1 Introduction
SoyTFtarget is a powerful server designed to predict regulatory relationships between transcription factors (TFs) and target genes in soybeans. The platform integrates three core components: co-expression analysis of TFs and target genes, TF binding site prediction, and a machine learning model trained using DAP-seq data. In addition, we manually curated 63 experimentally validated TF-target interactions.
By integrating these three core functions, SoyTFtarget constructs upstream and downstream regulatory networks for TFs and provides users with visualization capabilities.
Through the combination of multiple analytical methods, SoyTFtarget offers reliable TF-target interaction predictions, serving as a valuable resource for soybean genomics researchers.
2 Data and Methods
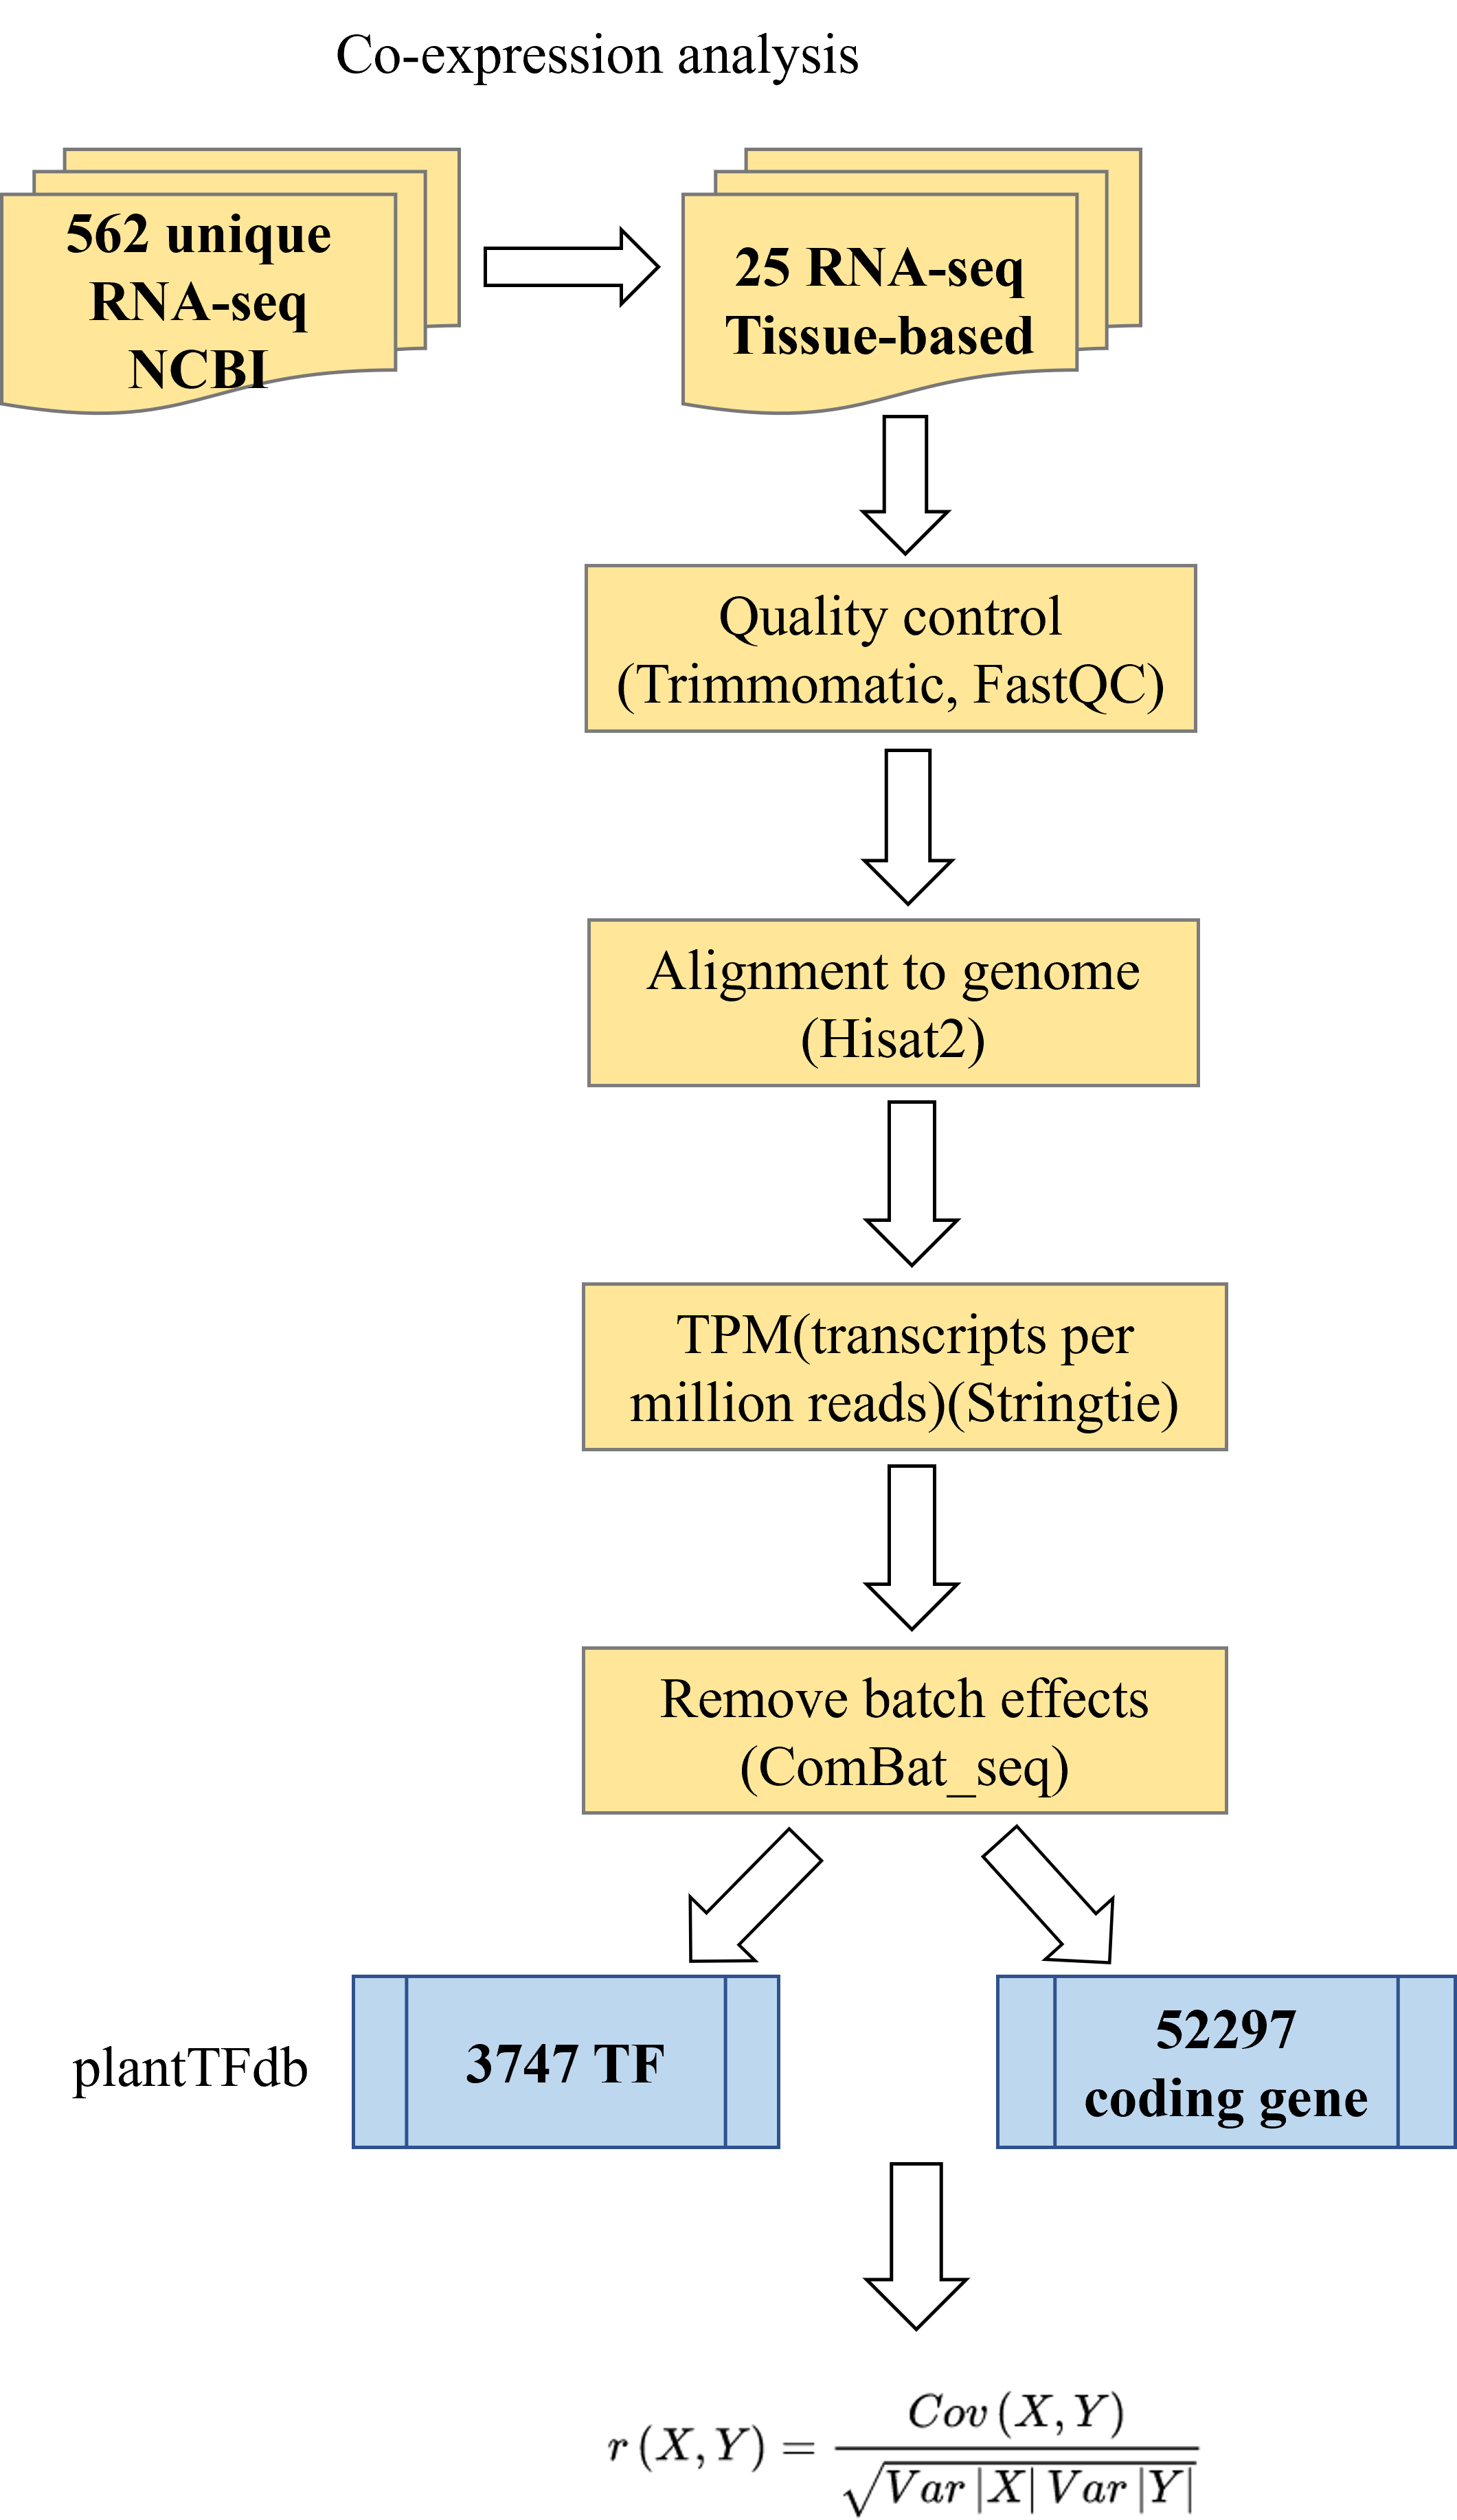
2.1 Co-expression Analysis
We collected 562 unique soybean RNA-seq datasets from NCBI, from which 25 representative samples of different soybean tissues were selected. Sequencing adapters and low-quality reads were removed using Trimmomatic (version 0.39), and the cleaned data were quality-checked with FastQC (https://www.bioinformatics.babraham.ac.uk/projects/fastqc). The data were then aligned to the soybean reference genome from Phytozome (Gmax_275_Wm82.a2.v1.gene.gff3) using Hisat2 (version 2.1.0). We used Samtools (version 1.9) to convert the resulting SAM files to BAM format and sort them. Gene expression levels in TPM (transcripts per million reads) were calculated using StringTie (version 1.3.6) based on the Phytozome gene annotation file. TF expression levels were extracted using annotation information from PlantTFDB(https://planttfdb.gao-lab.org/), while expression levels for other non-TF protein-coding genes were also computed. Genes with TPM values of 0 in all samples were filtered out. To adjust for batch effects, we applied the Combat-seq method from the SVA package (version 3.40.0). Finally, the Pearson correlation coefficient (PCC) was calculated to assess the correlation between gene expression levels, with values closer to 1 or -1 indicating stronger co-expression relationships.
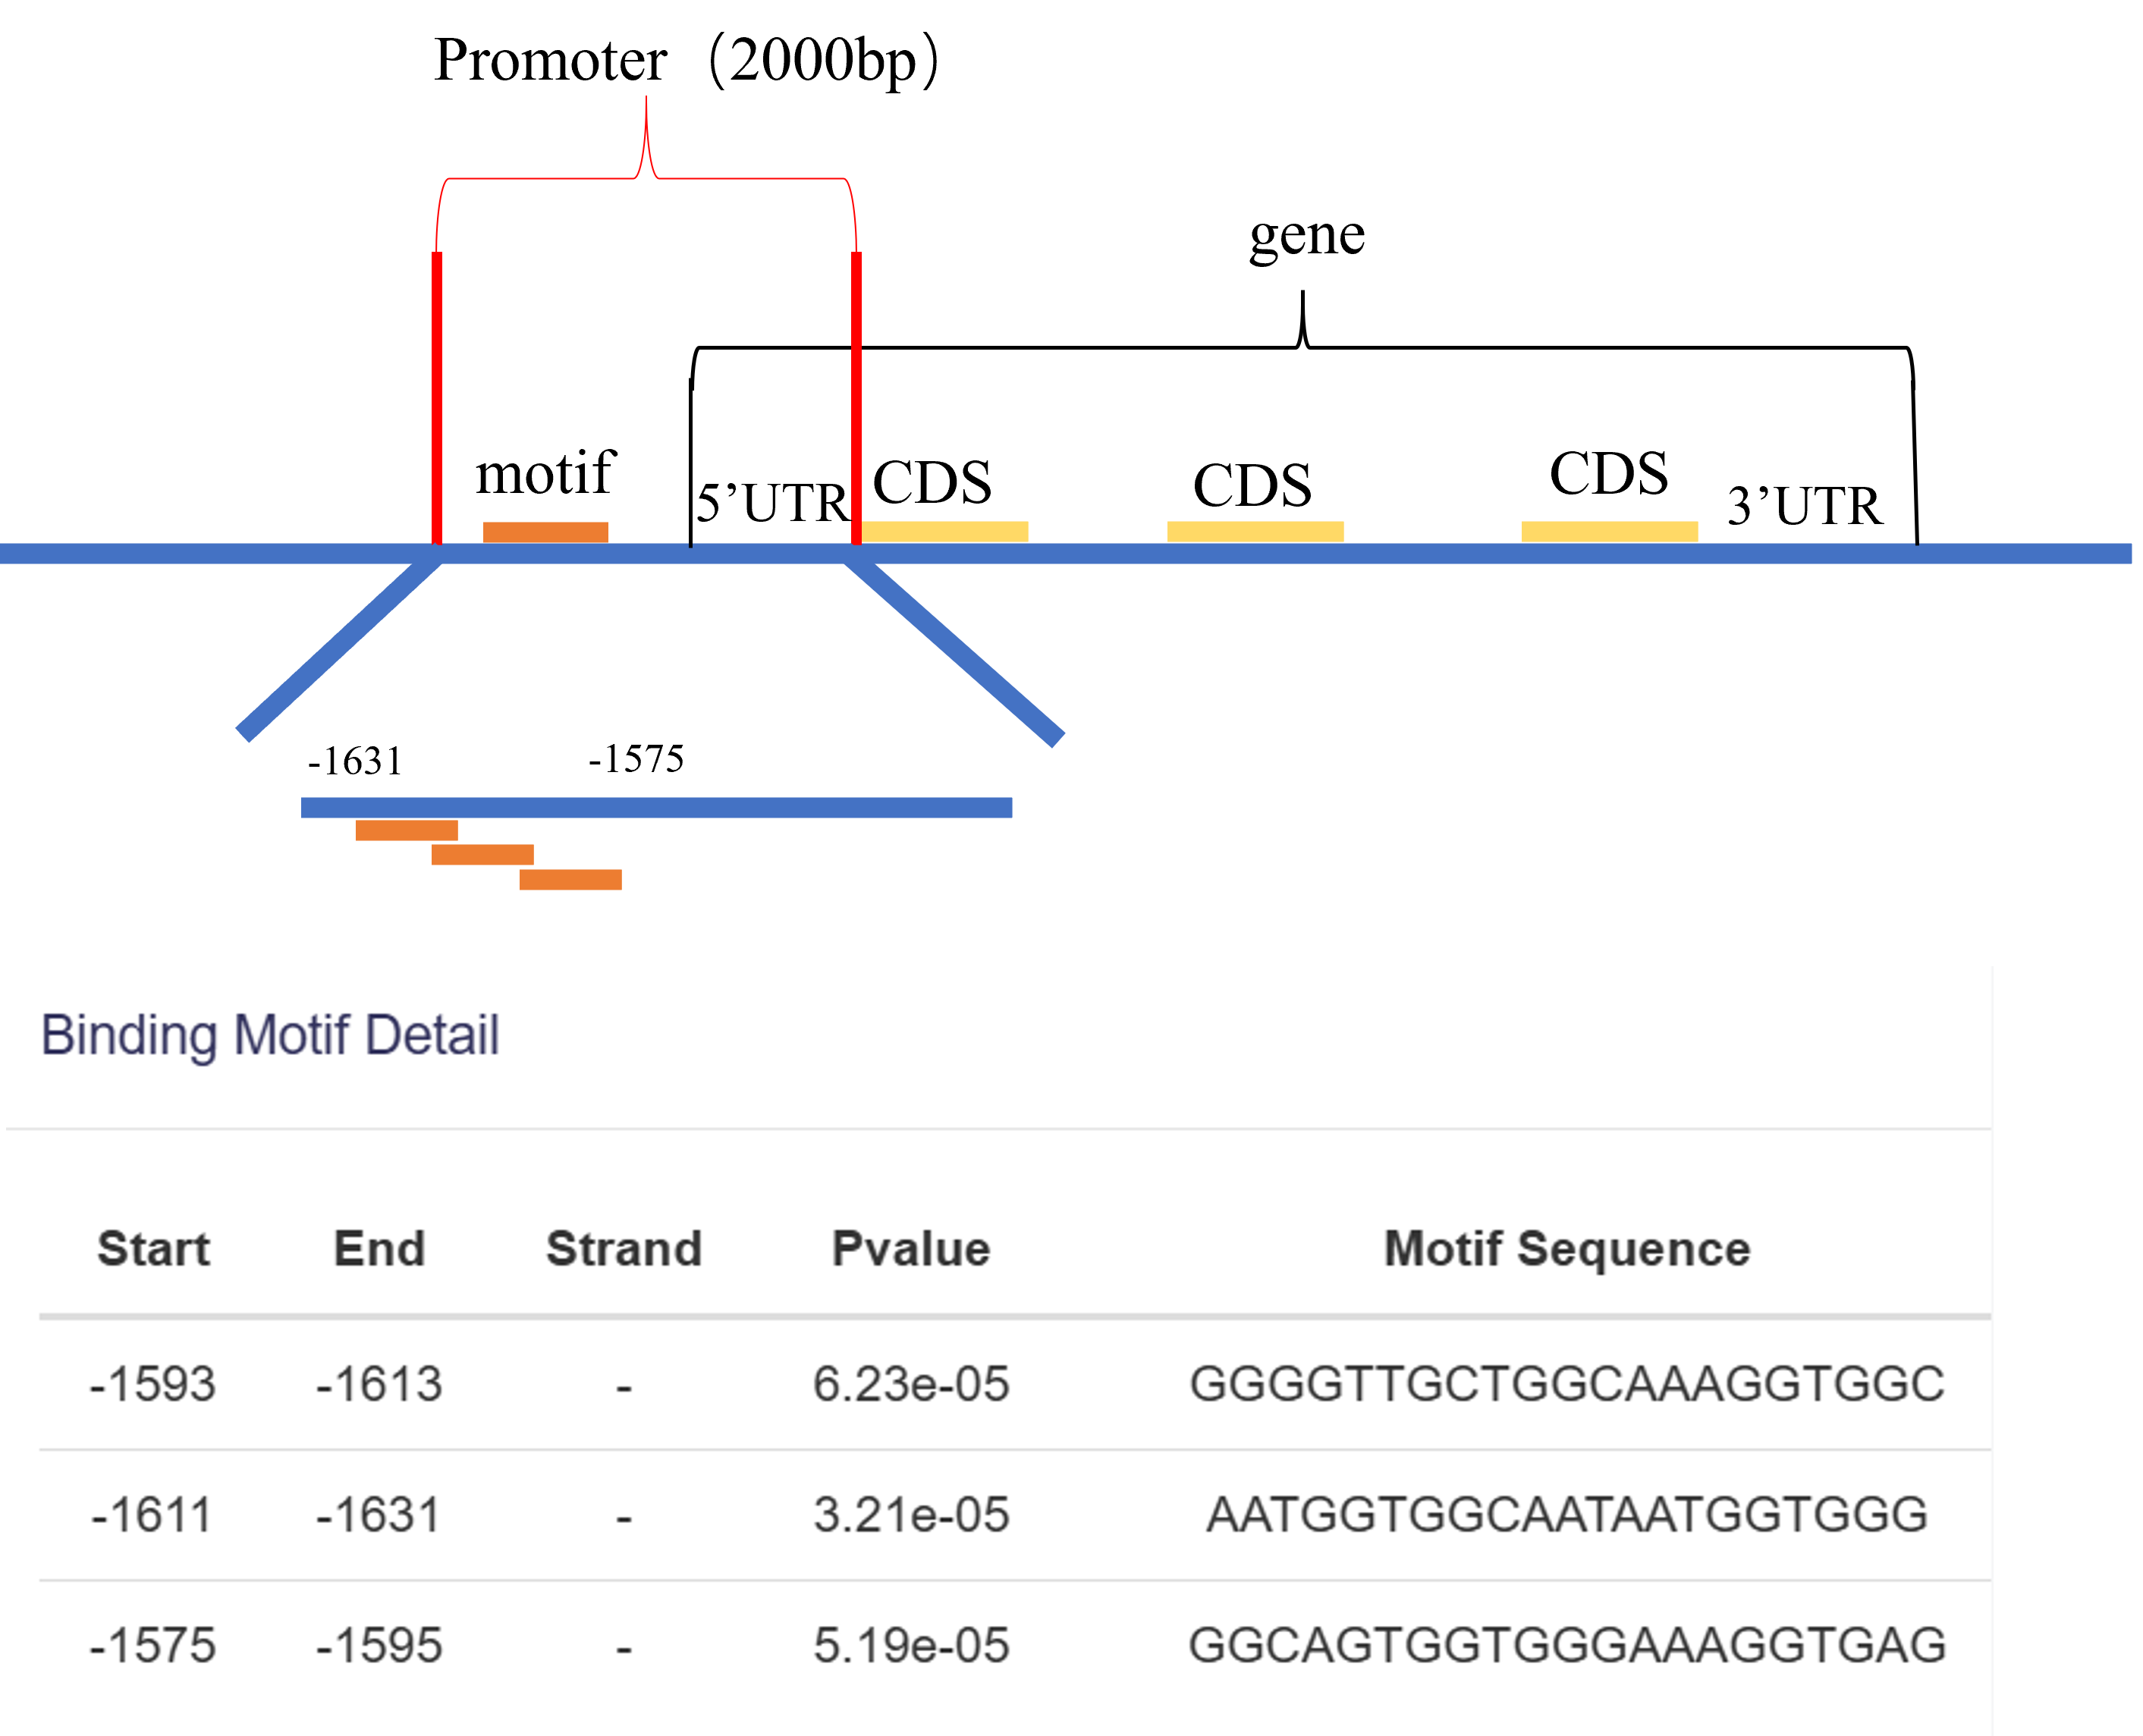
2.2 TF Binding to Target Gene Promoters Analysis
Extract the first 2000 bp upstream of the first CDS for each gene as the promoter region. Using the FIMO software, predict the binding of transcription factor motifs within the promoter regions.Regions with a p-value less than 0.05 are considered predicted binding sites.
2.3 Machine Learning Model Prediction Analysis
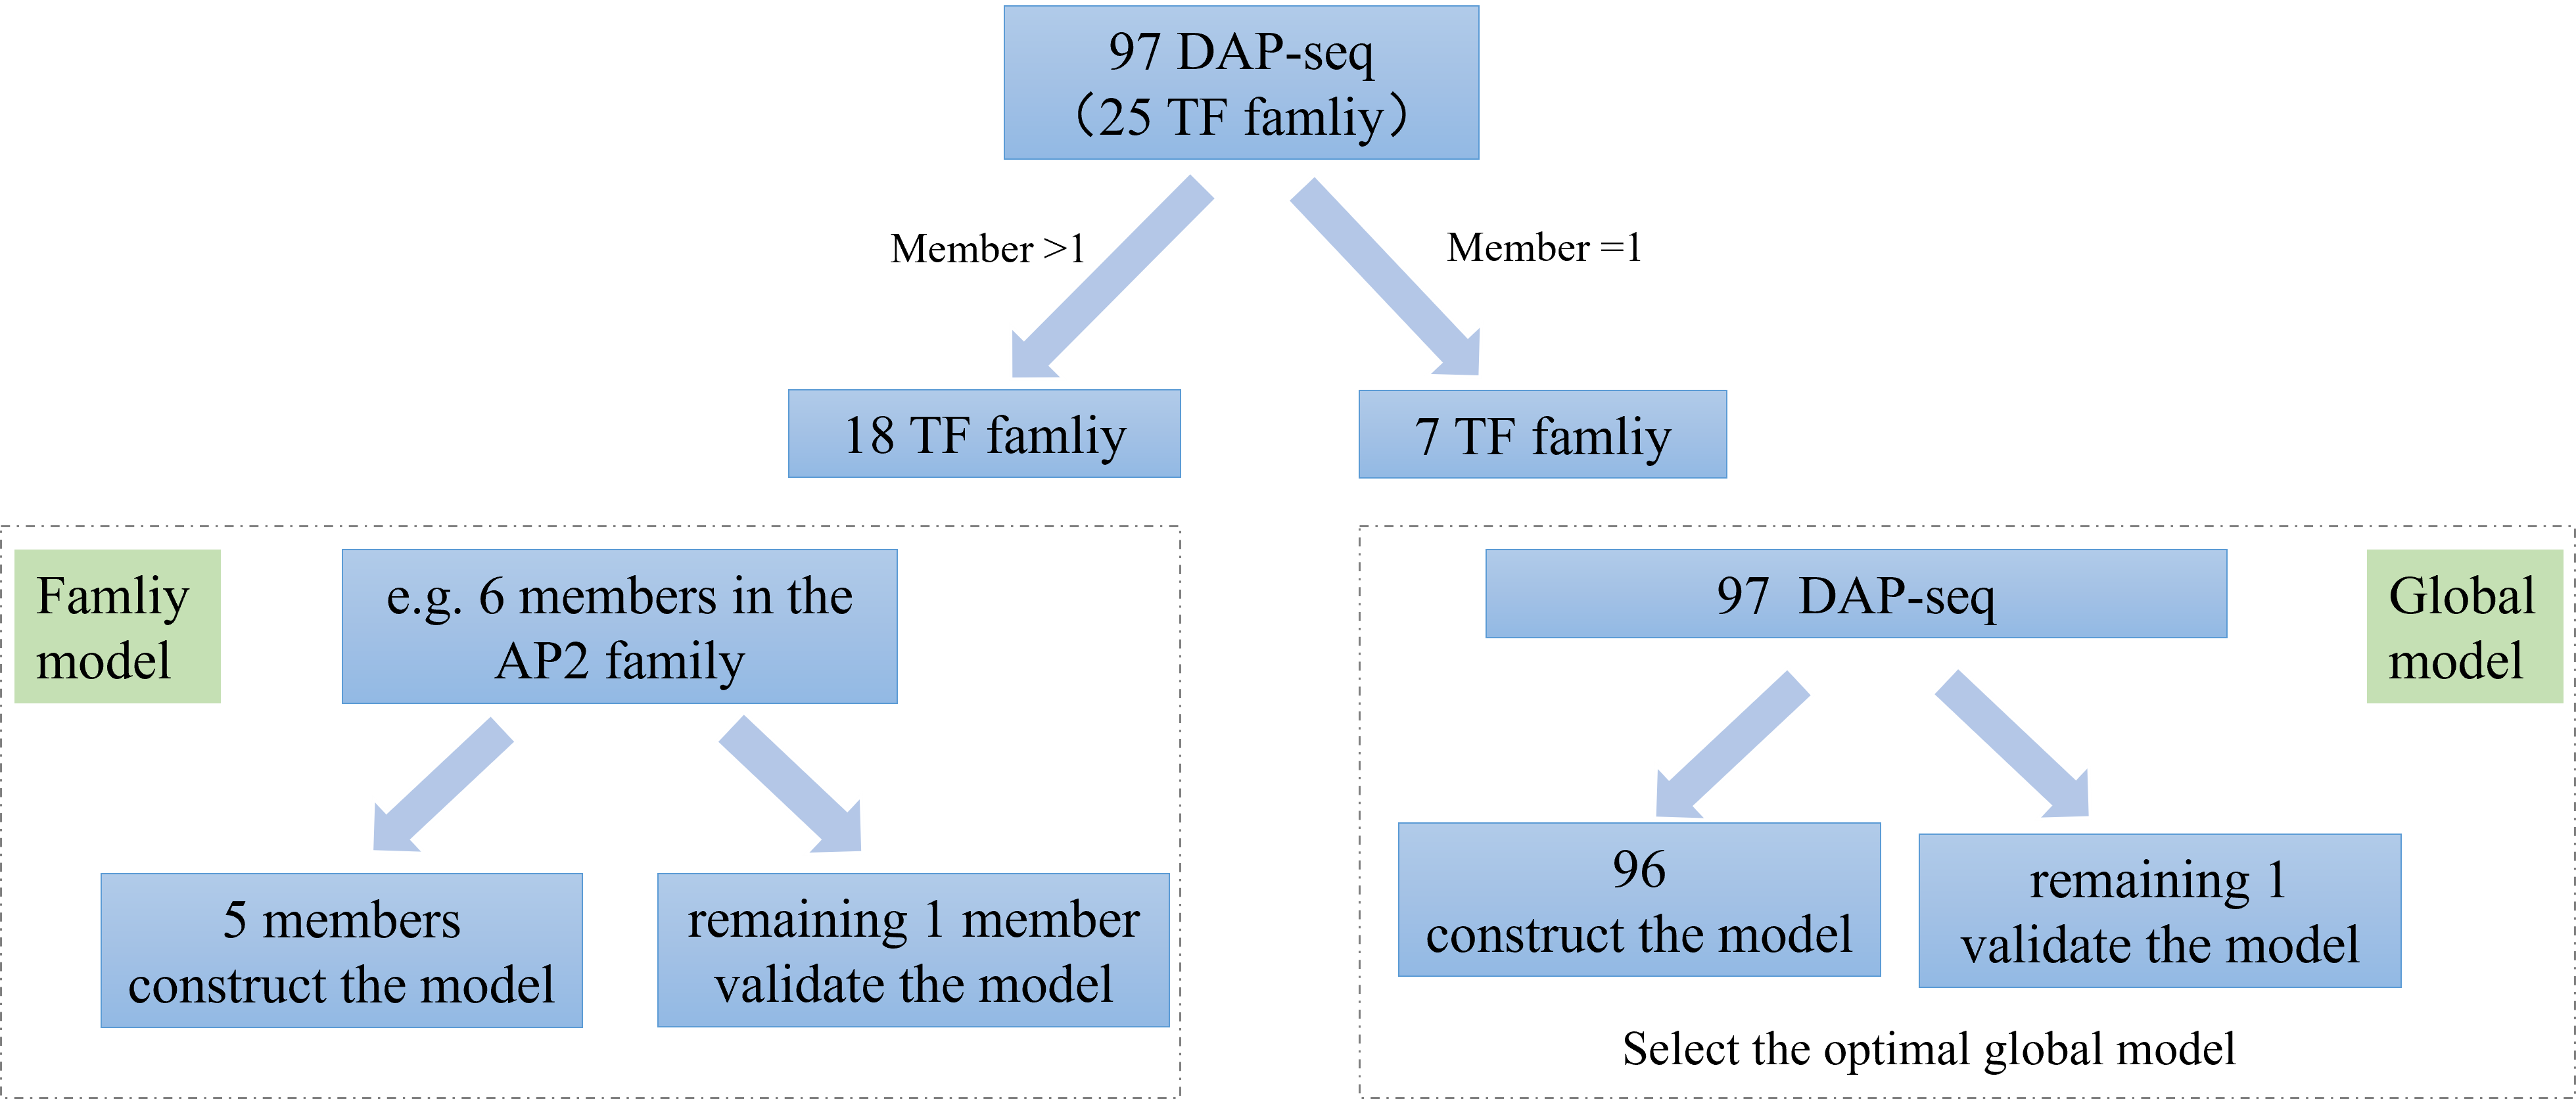
Using DAP-seq data from 97 transcription factors (TFs) across 25 families, machine learning prediction models were constructed. Binding sites scanned from the TFs across the genome were used to extract 33 features for model training. The features are shown in the figure below, including match score, kmer, etc. The XGBoost algorithm was employed to build two types of prediction models: 18 family-specific models for the 18 TF families with more than one member, and a global model created by combining data from 96 out of the 97 TFs.
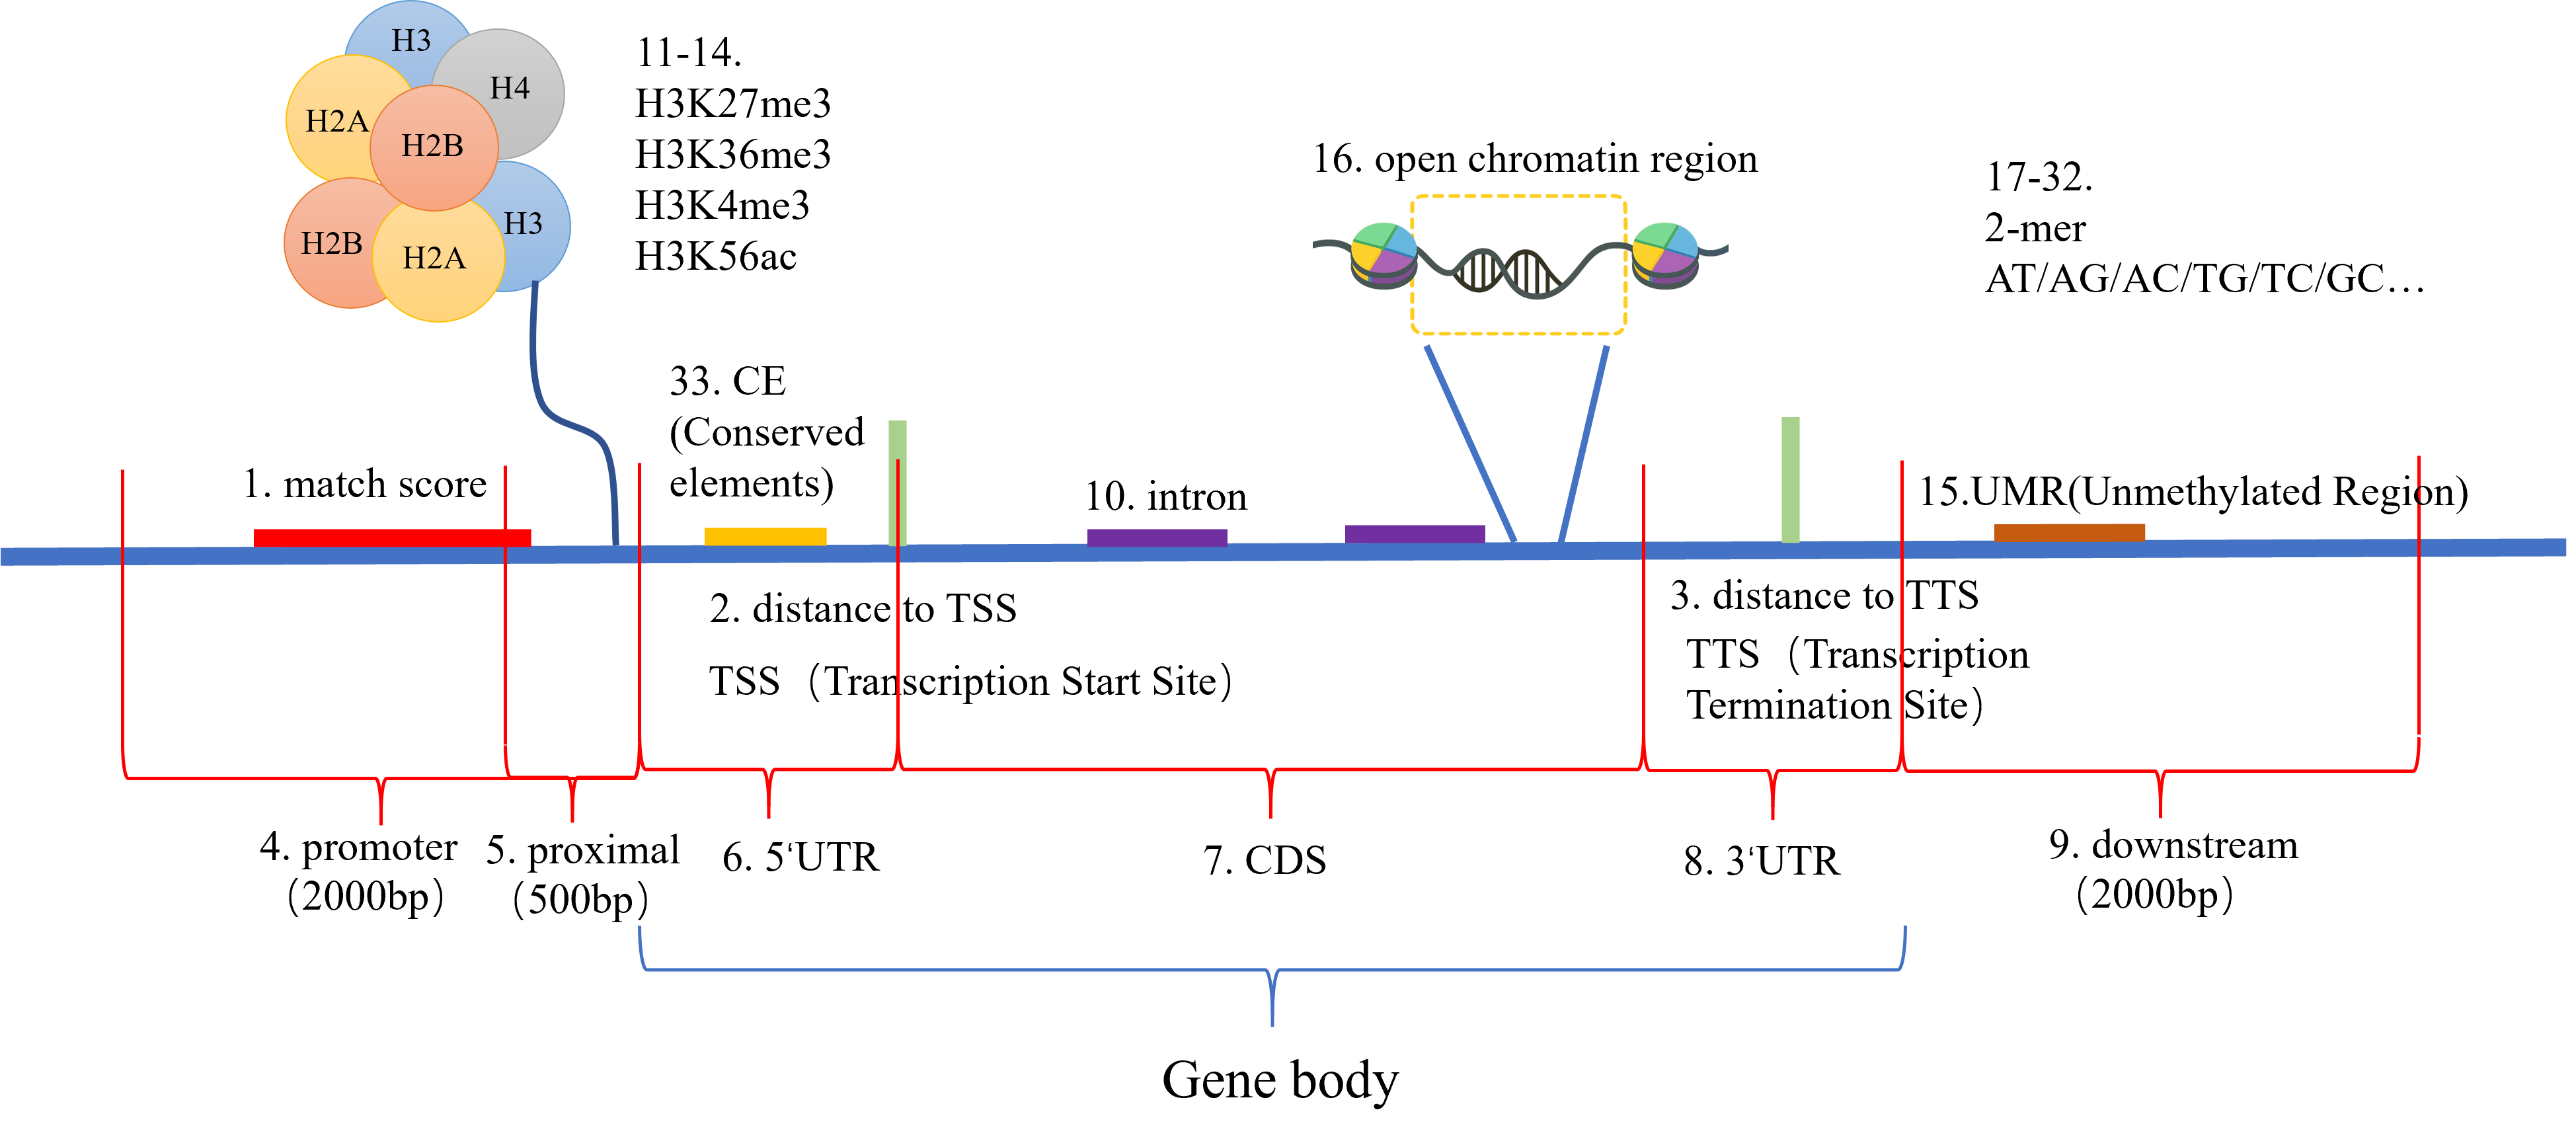
The DAP-seq data includes 97 transcription factors from 25 soybean families, categorized into 18 families with multiple members and 7 families with single members. 18 family models and a global model were built.
3 Database Usage
3.1 Overview
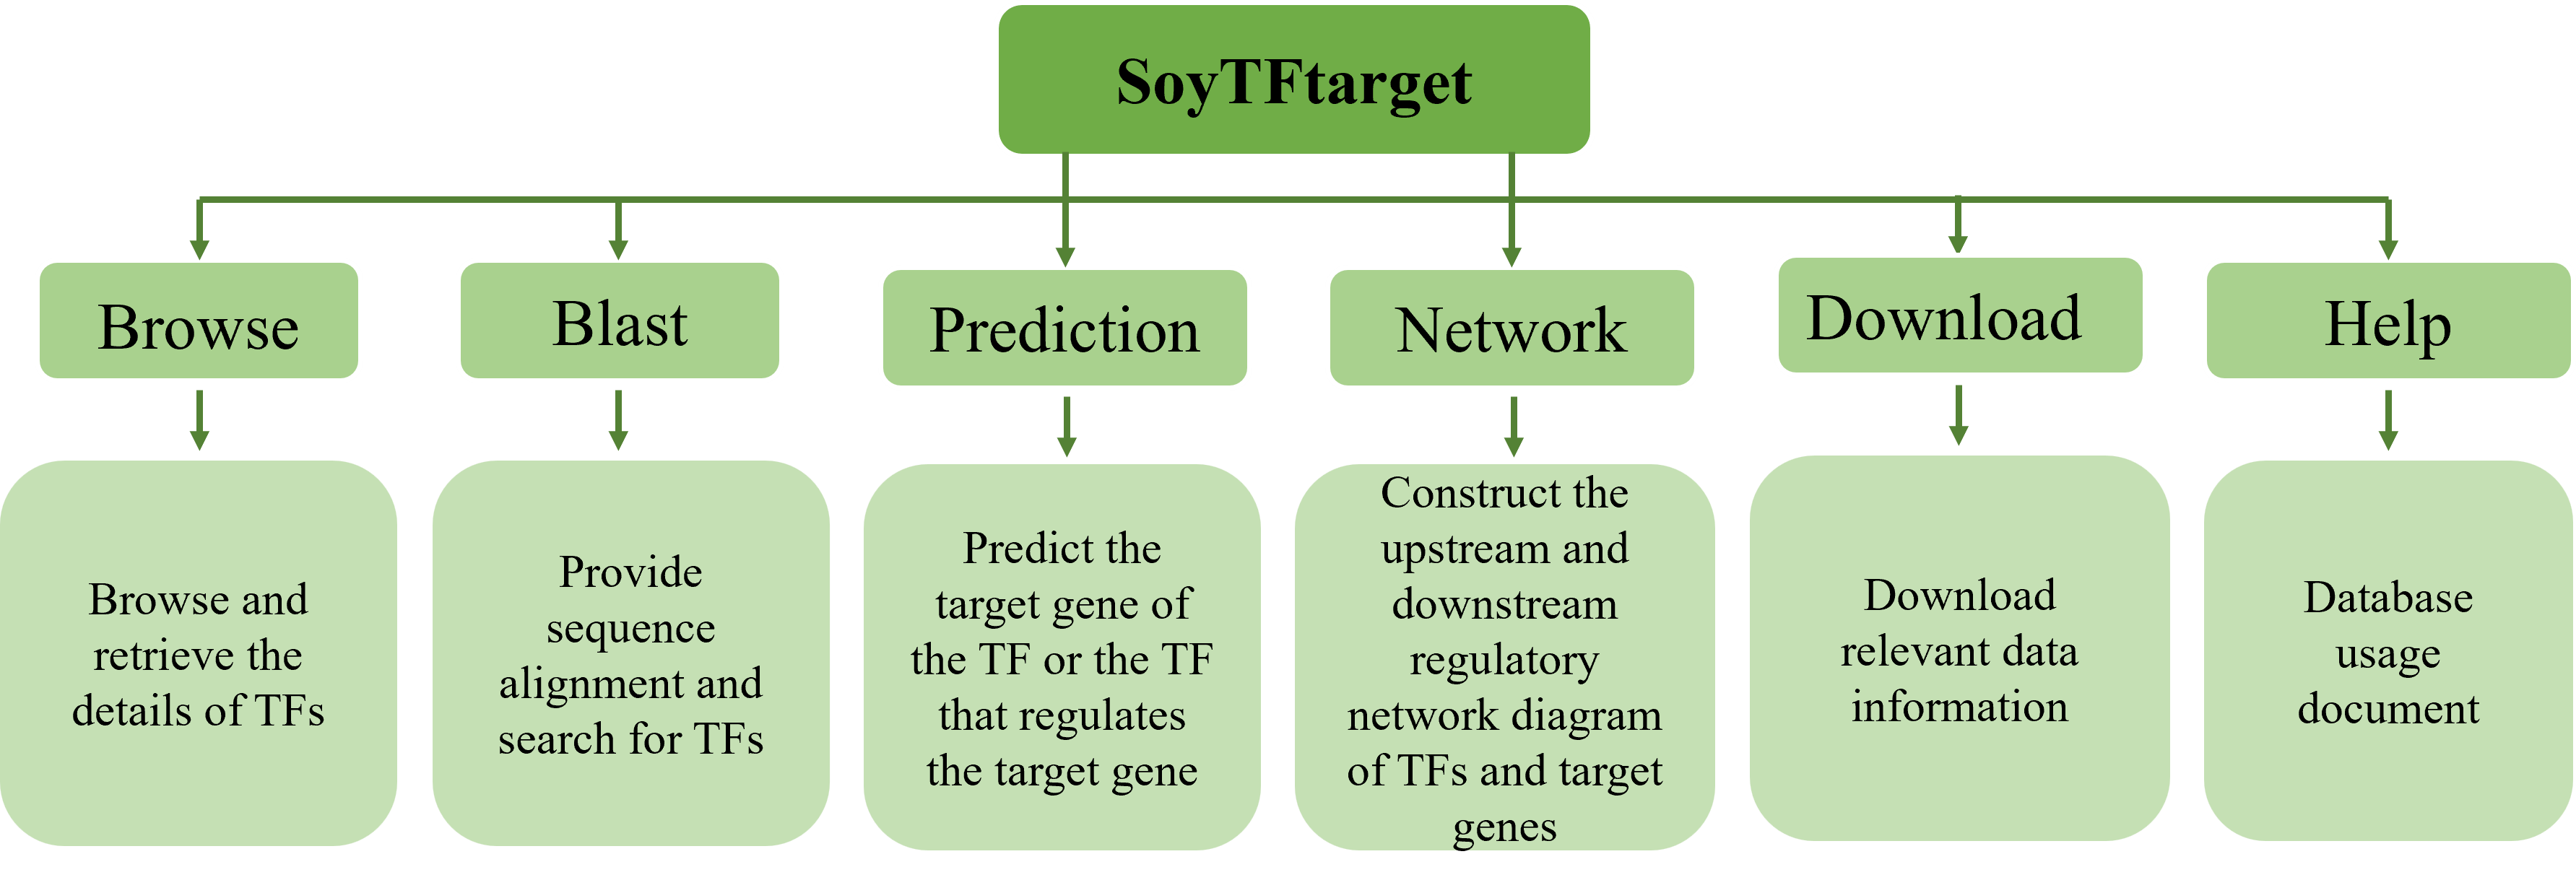
3.2 Browse
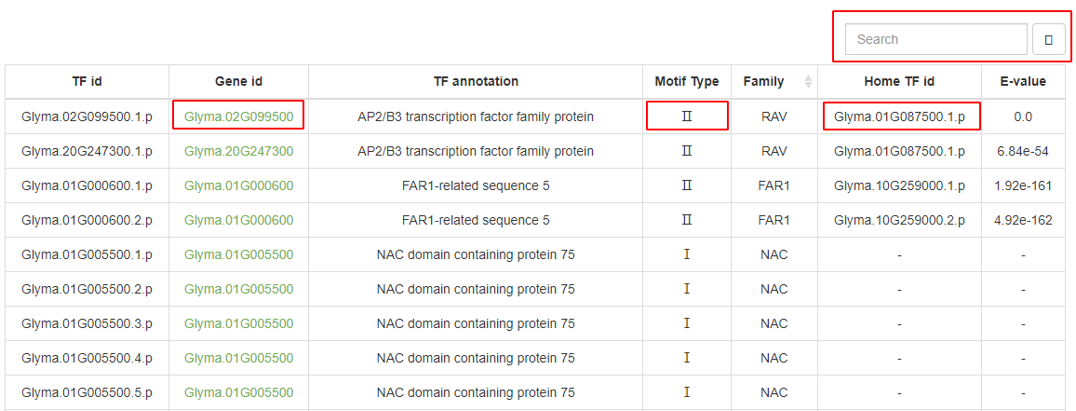
The Browse page displays basic information for 3,747 soybean transcription factors (TFs) and categorizes the binding motifs into three types:
I: A set of manually curated, non-redundant, high-quality TF binding motifs that includes motifs from both PlantTFdb and those obtained from DAP-seq.
II: TFs within the same family that have sequence similarity (e-value < 1e-4) to Type I TFs share the same motif.
III: TFs with no binding motifs (e-value > 1e-4).
Clicking on the TF gene ID redirects to the detailed information for that gene in the Phytozome database. A search function is available in the top right corner of the browse table.
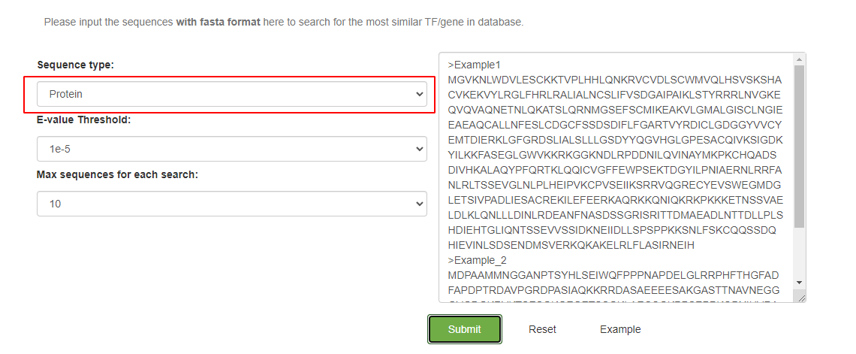
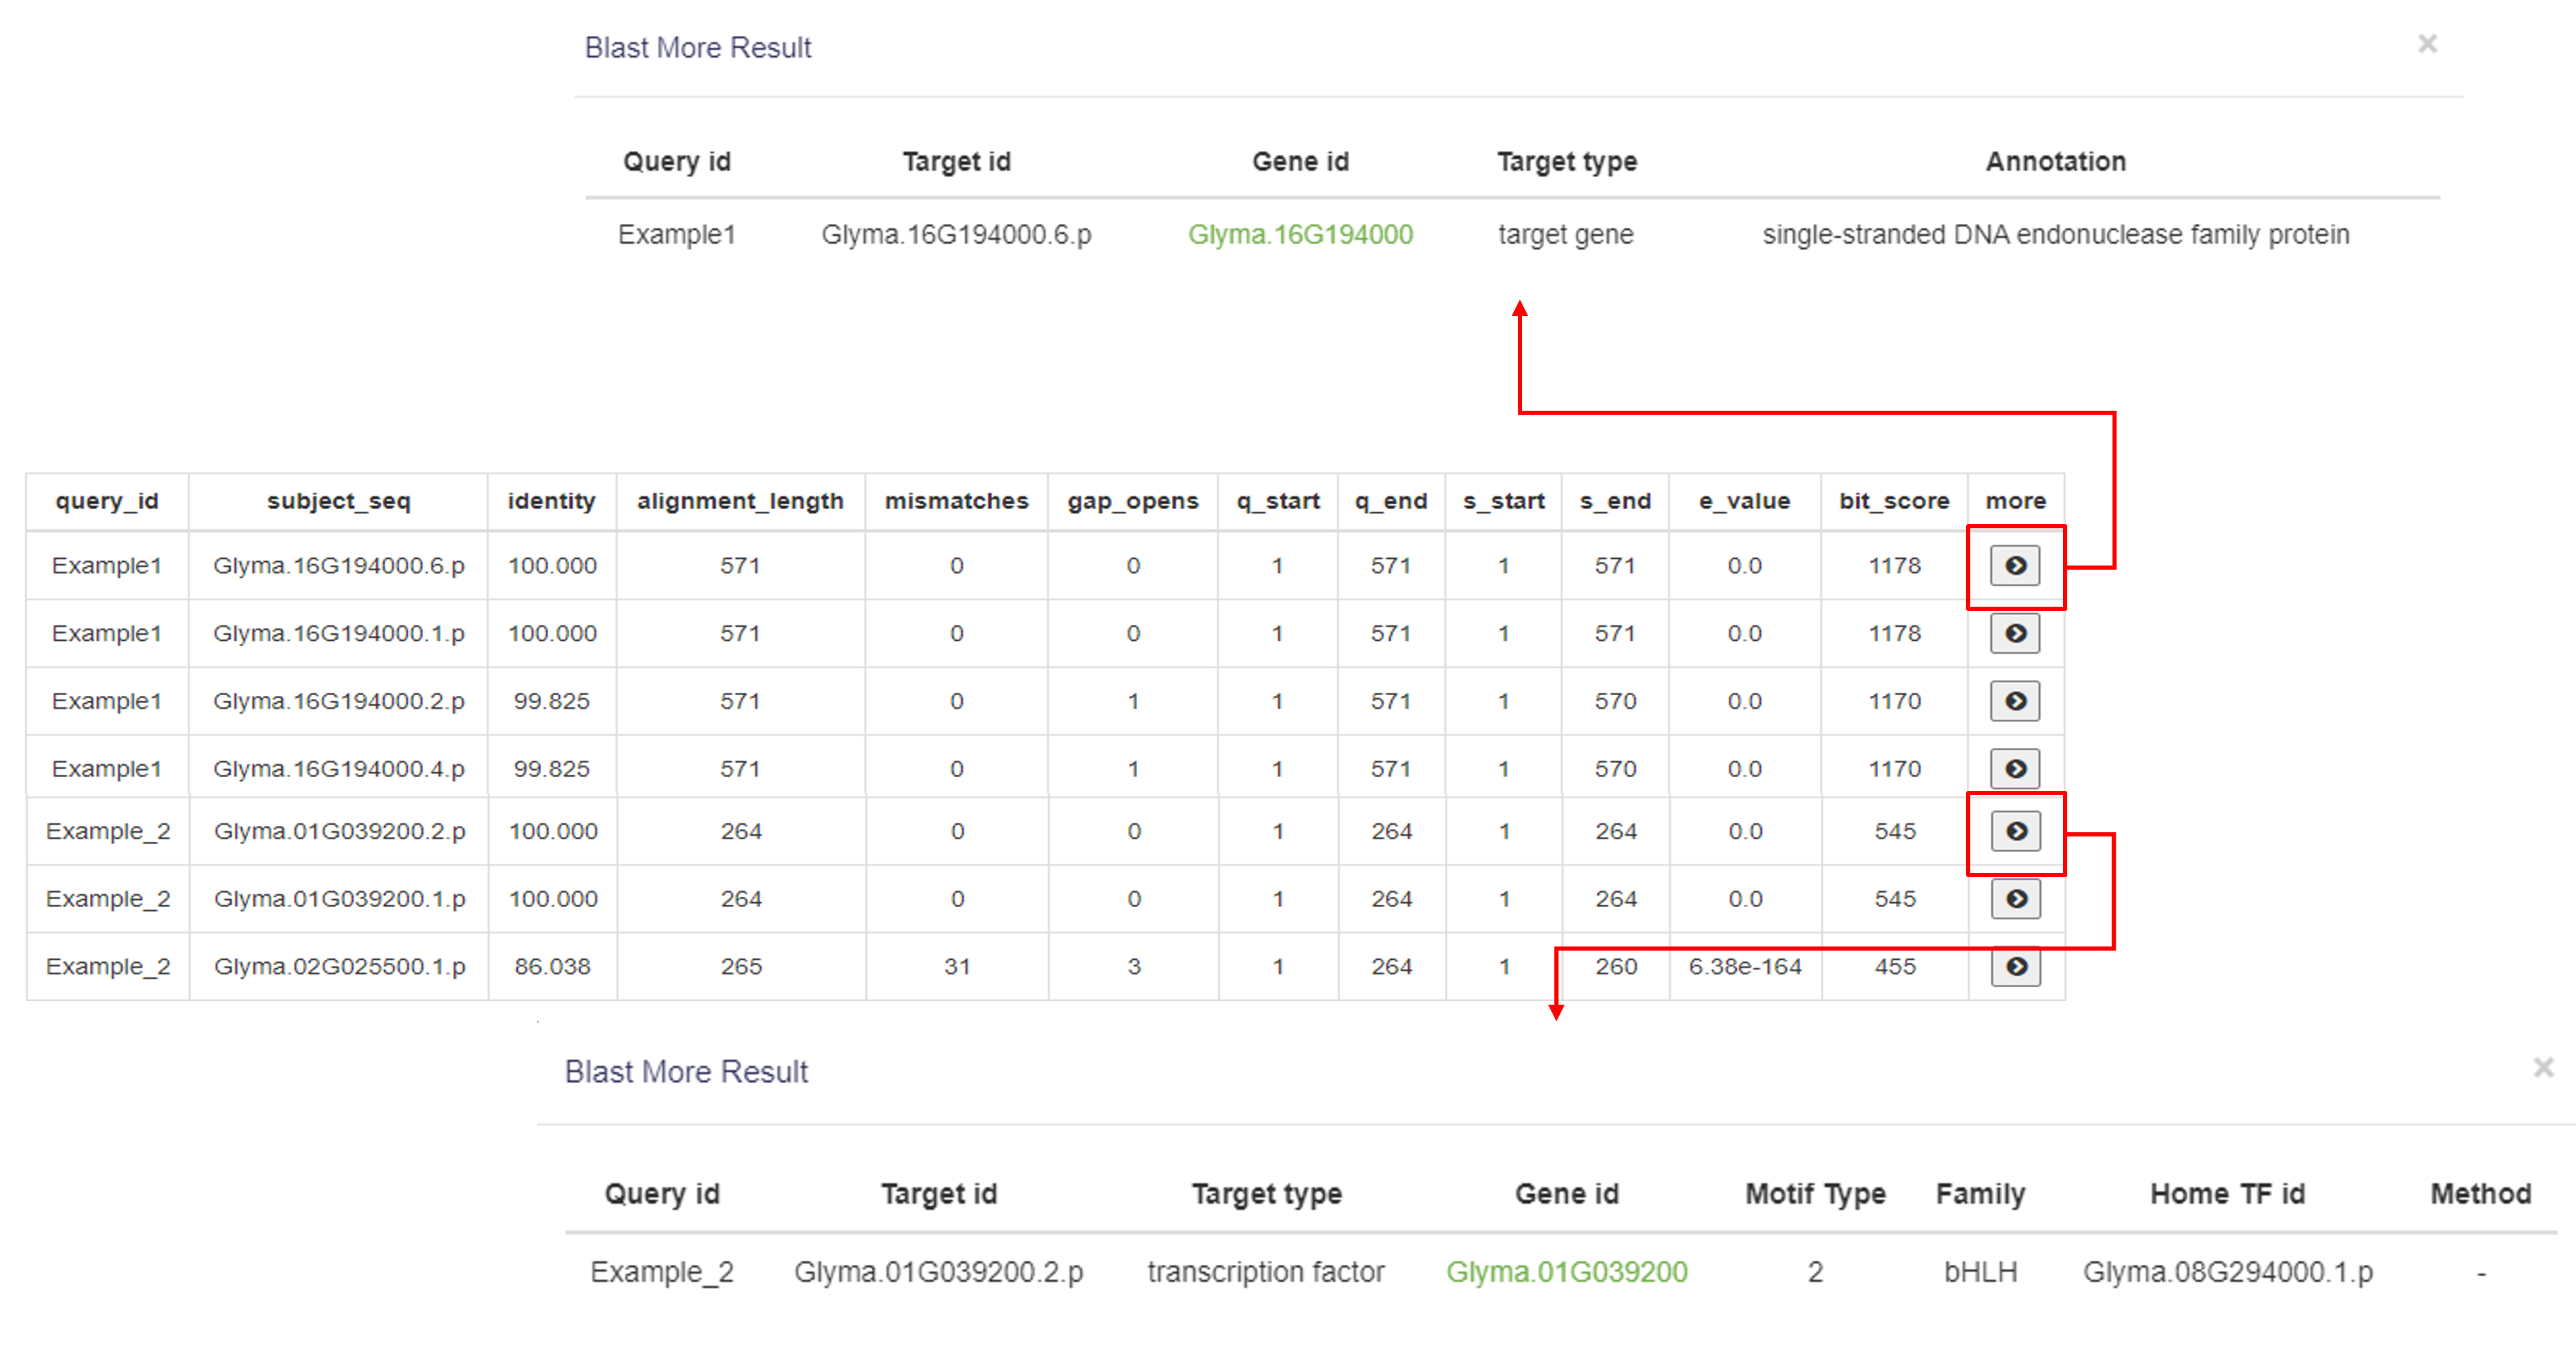
3.3 Blast
On the Blast page, users can input DNA or protein sequences to search for transcription factors (TFs) and target genes in the database.
The Blast result displays the following information for each match:
1.The input sequence ID.
2.The matched sequence ID.
3. The alignment rate.
4. The alignment length.
5. The number of mismatches.
6. The number of gaps.
7. The alignment start position of the input sequence.
8. The alignment end position of the input sequence.
9. The start position of the matched sequence.
10. The end position of the matched sequence.
11. E-value (the smaller the E-value, the better the match).
12. The score of the alignment.
By clicking More in the last column, if the match is a TF, it will display the TF's motif information; if it's a target gene, the gene annotation will be shown.
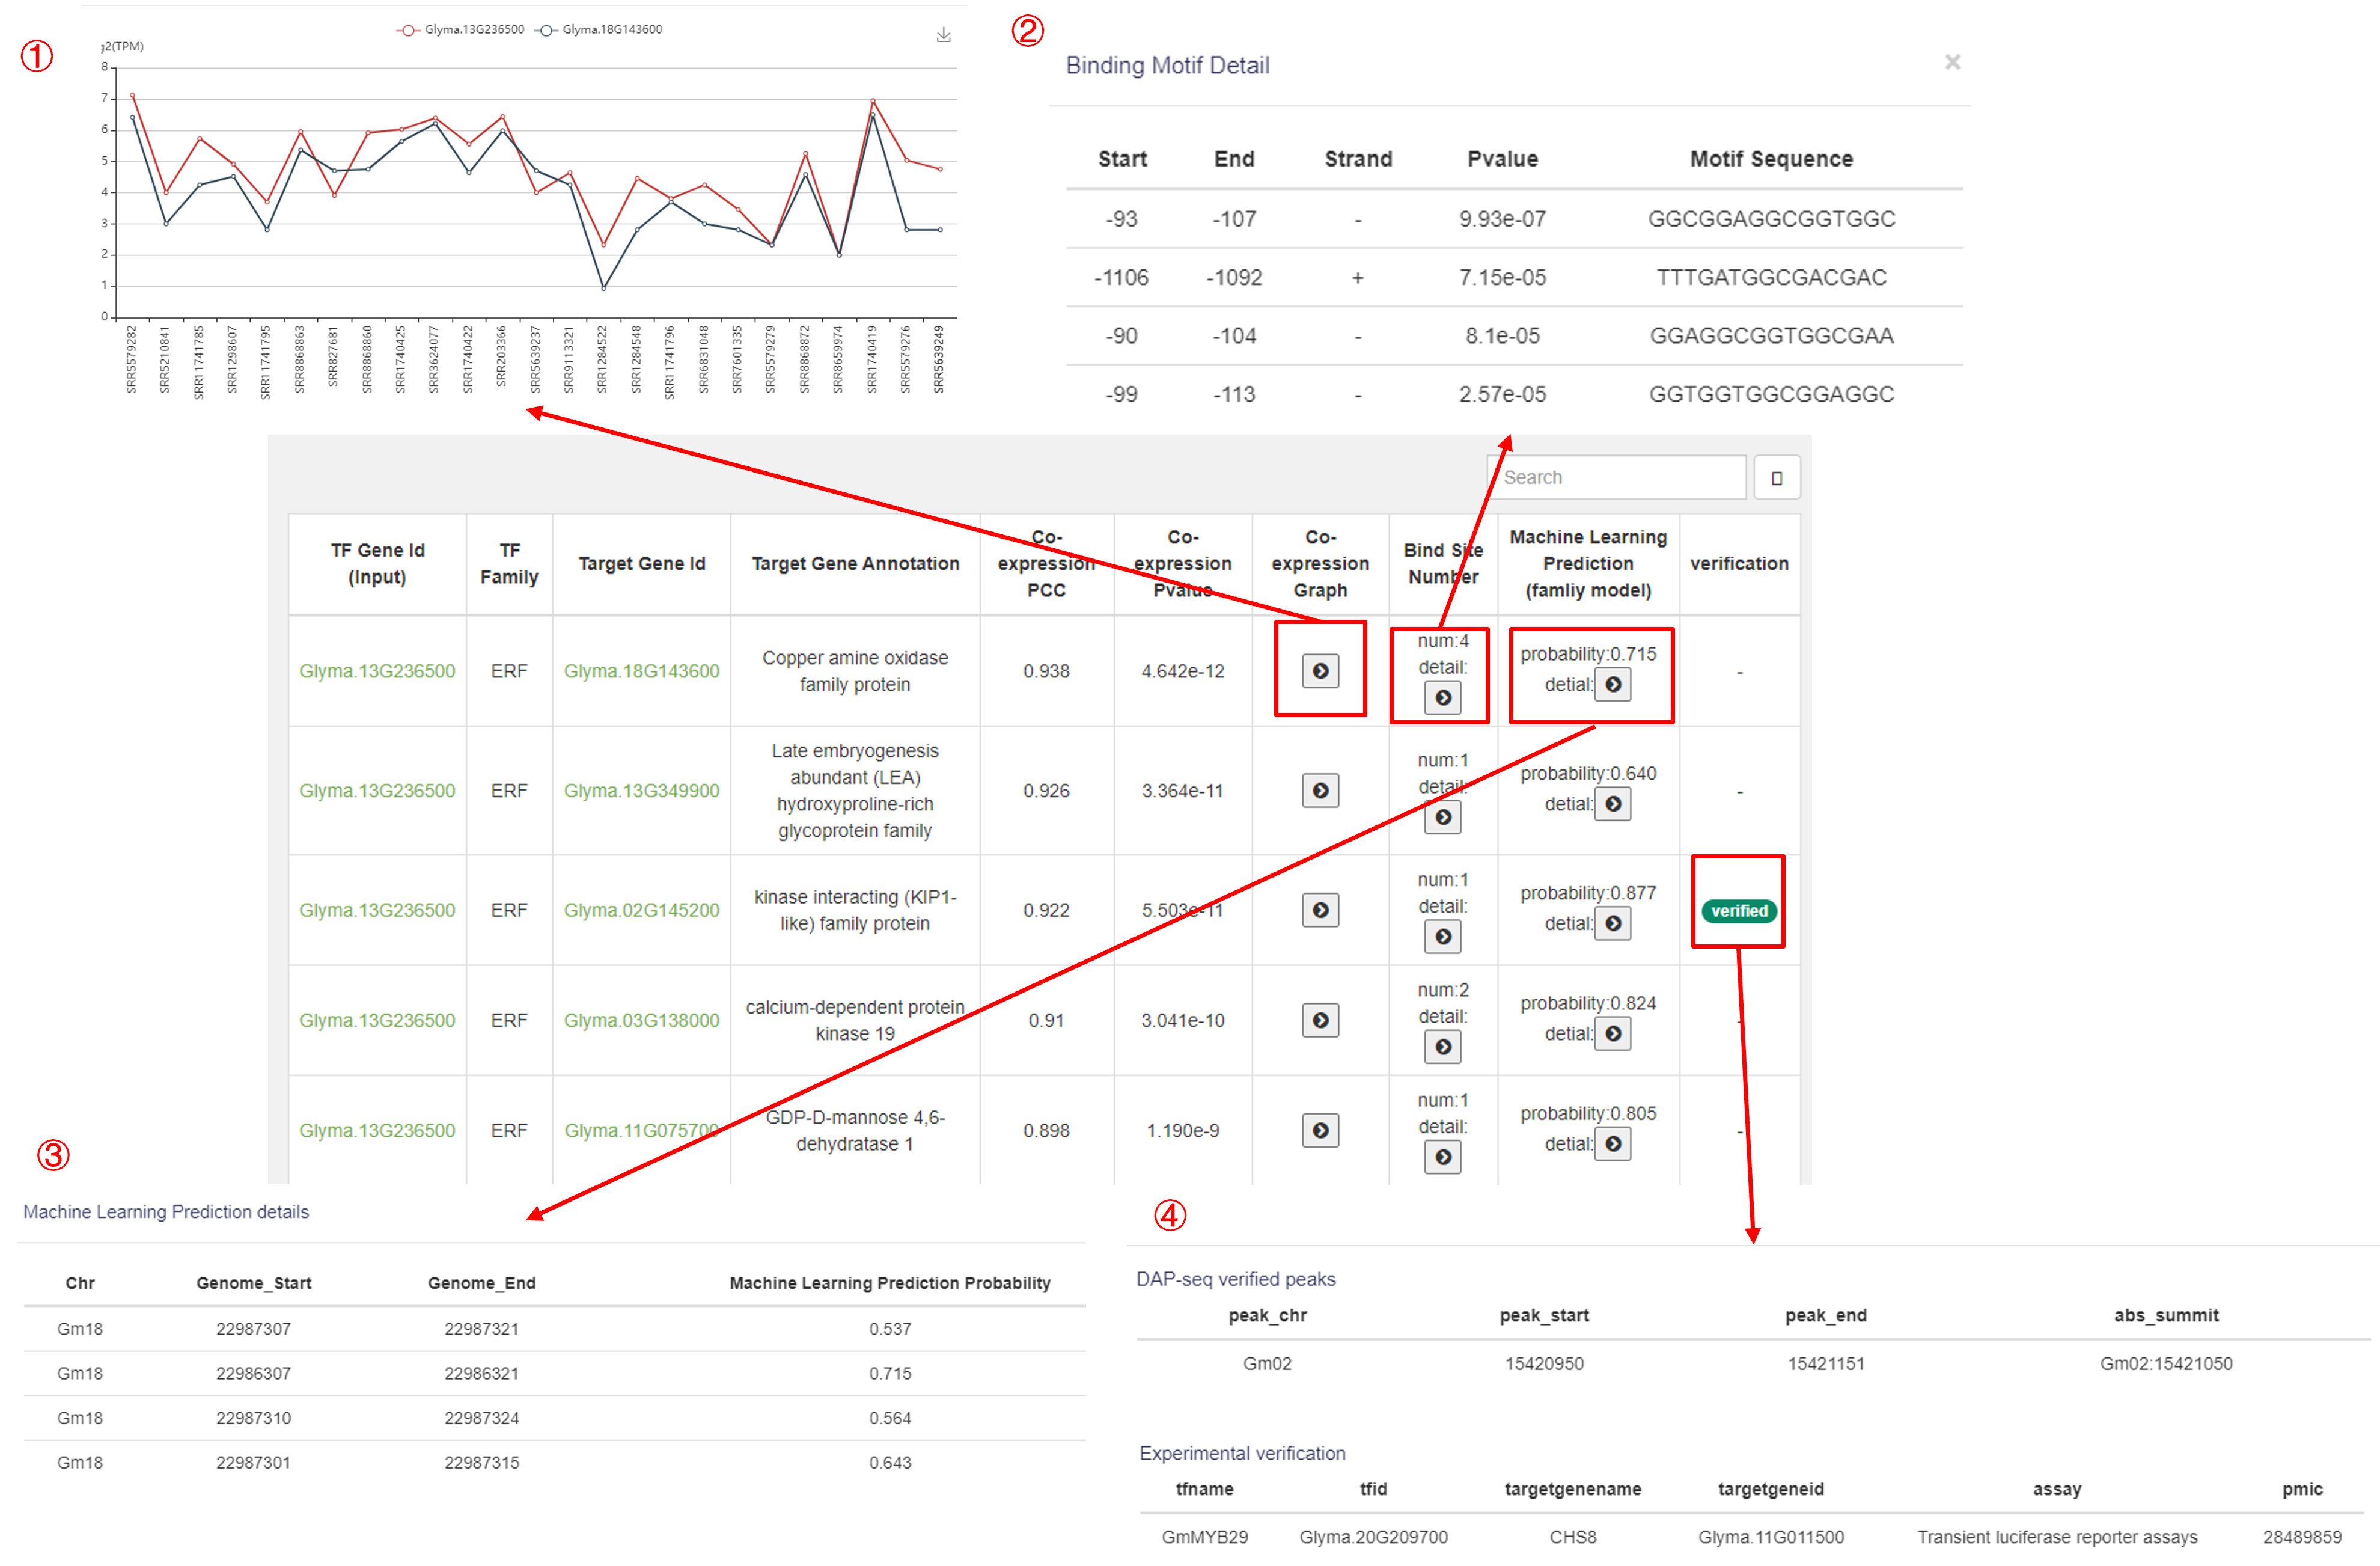
3.4 Prediction
The Prediction function allows users to input a transcription factor (TF) to predict its downstream target genes, or to find its upstream TFs. Similarly, users can input a target gene to identify its upstream TFs.
The Prediction results display the following information for each match:
1. Input TF gene ID.
2. TF family.
3. Target gene ID.
4. Target gene annotation.
5. Co-expression PCC (Pearson Correlation Coefficient).
6. Co-expression p-value.
7. Expression line chart for both genes across 25 samples.(①)
8. Binding site and sequence prediction.(②)
9. Machine learning model prediction of the probability for each binding site.(③)
10. DAP-seq validation and experimental literature validation.(④)
This function helps explore regulatory relationships between TFs and target genes.
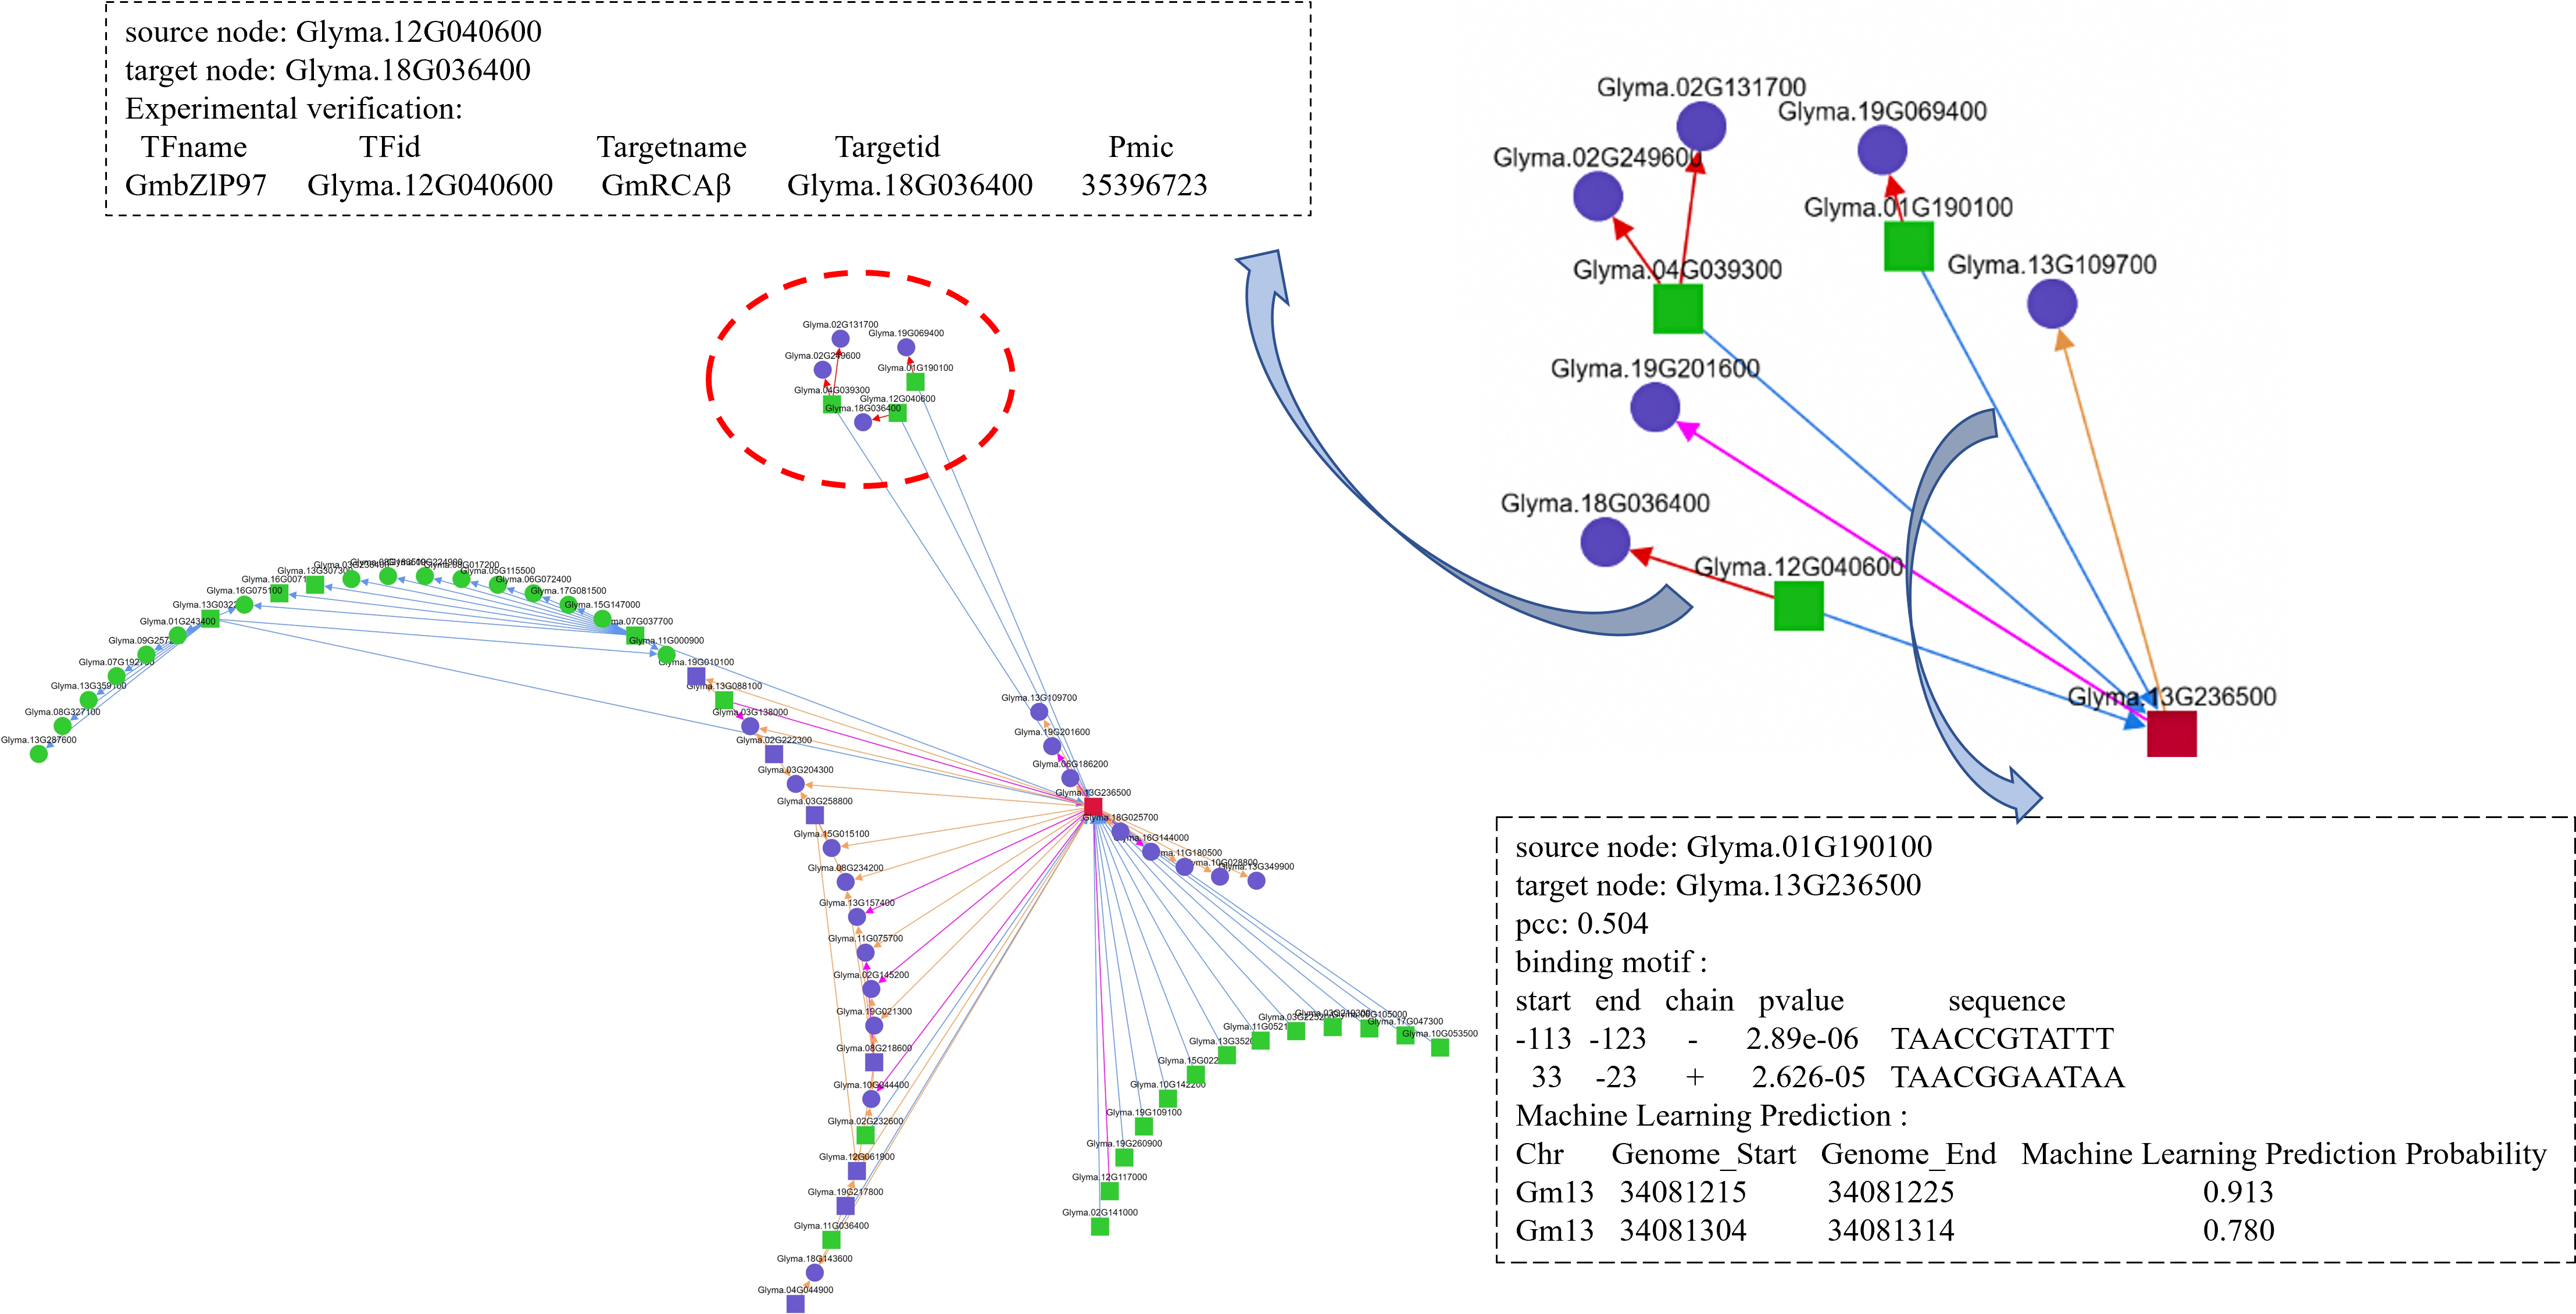
3.5 Network
The Network function allows users to select different network depths. When the network depth is set to 1, the upstream and downstream each consist of one layer. When the depth is 2, an additional layer is extended from the first layer.
When the network depth is 2, the running time will be longer compared to depth 1.
In the network diagram, different colors represent upstream and downstream elements, and different shapes distinguish TFs from target genes.
Arrows point from upstream to downstream, and the color of the lines indicates upstream/downstream relationships as well as whether they have been validated.
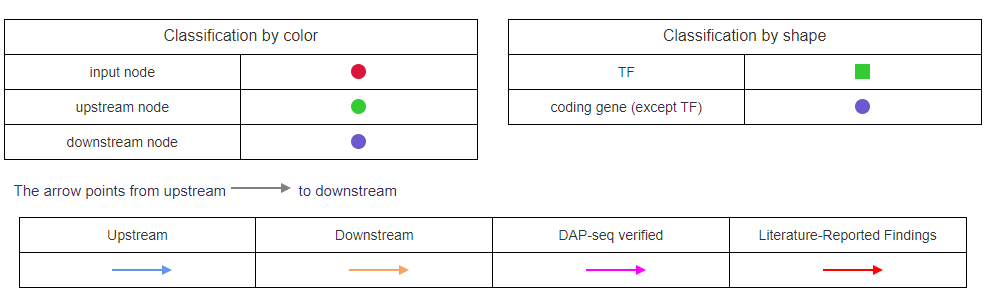
The network diagram can be downloaded, and a table provides detailed TF-target information from the network, making it easy for users to view and download the data.
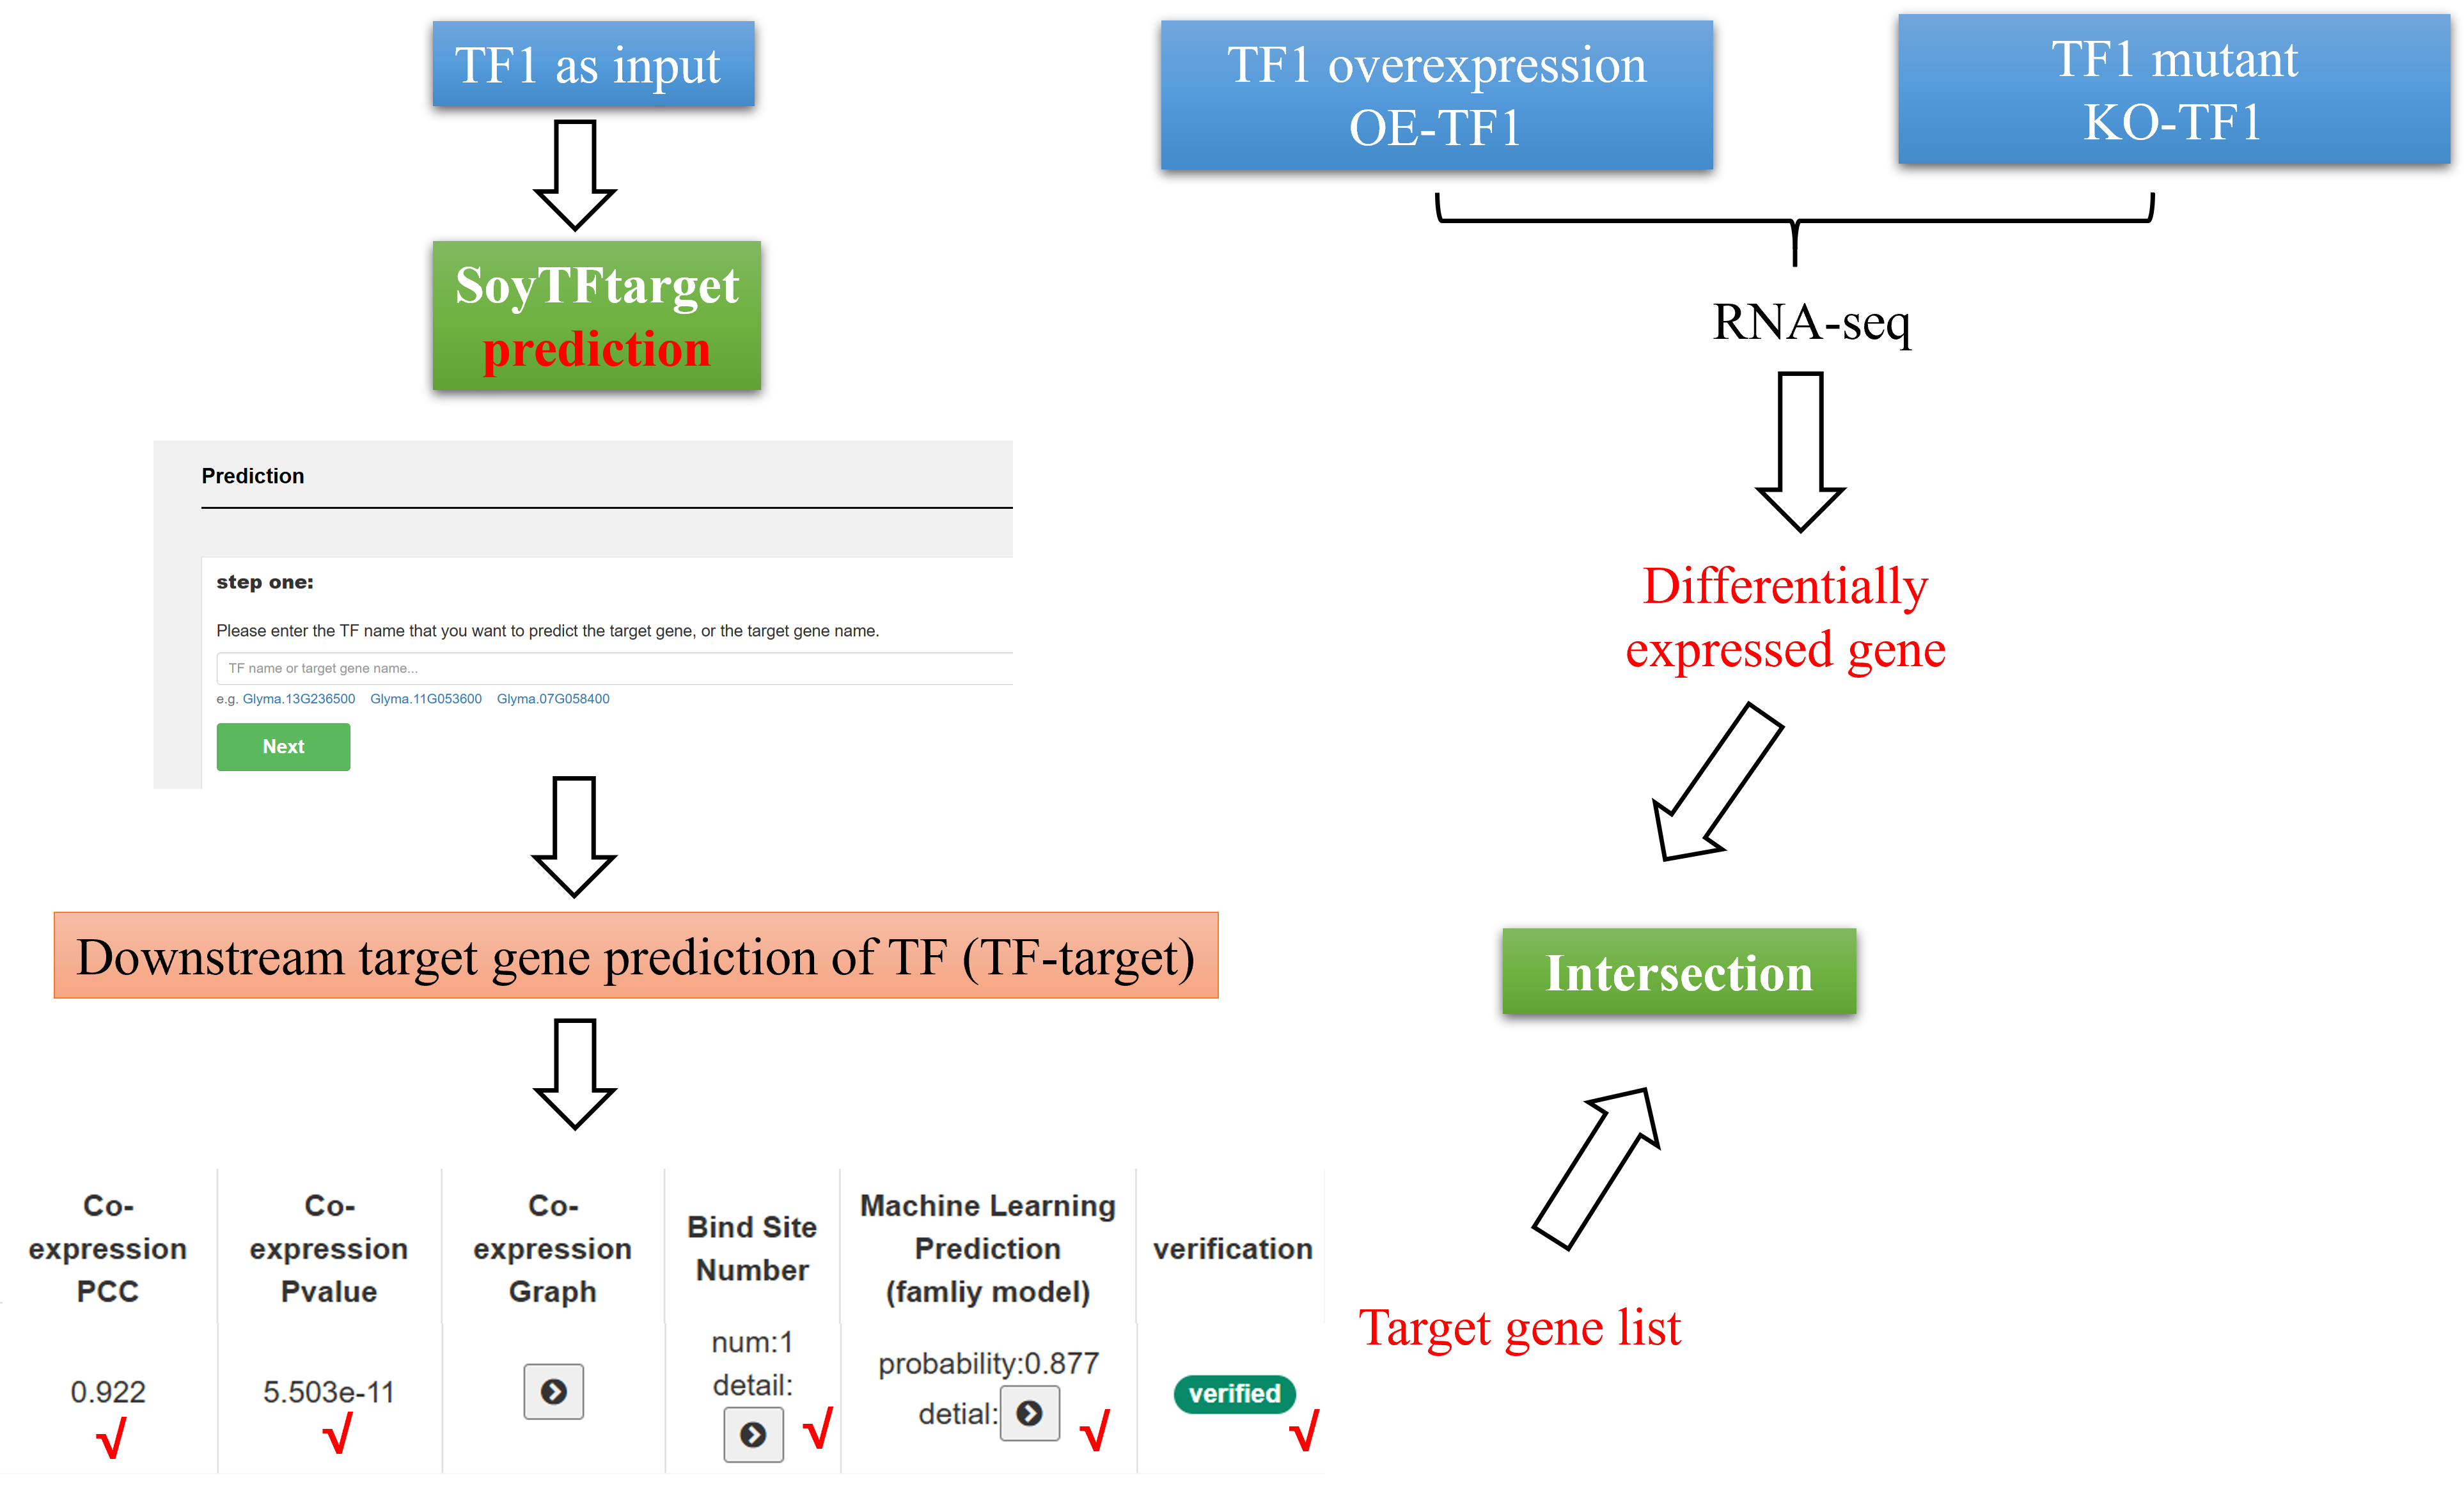
4 Use Case: Analyzing TF Regulatory Networks Using SoyTFtarget
If a user has overexpression (OE-TF1) and mutant (KO-TF1) materials for a transcription factor (TF1), combined with RNA-seq data, the SoyTFtarget tool can facilitate the analysis:
1. Downstream Target Gene Prediction:
Input TF1 into SoyTFtarget to predict its downstream target genes based on co-expression analysis, TF binding site predictions, and machine learning models. By intersecting the predicted target genes with differentially expressed genes (DEGs) from RNA-seq data, high-confidence target genes can be identified for further validation.
2. Upstream Regulatory Factor Identification:
Input DEGs into SoyTFtarget to predict upstream regulatory TFs that potentially control these genes.
3. Regulatory Network Visualization:
Using SoyTFtarget's network module, generate an integrated upstream and downstream regulatory network of TF1, providing insights into its role in transcriptional regulation.
This workflow bridges experimental data and computational predictions, offering a comprehensive view of TF1's regulatory landscape.