Introduction
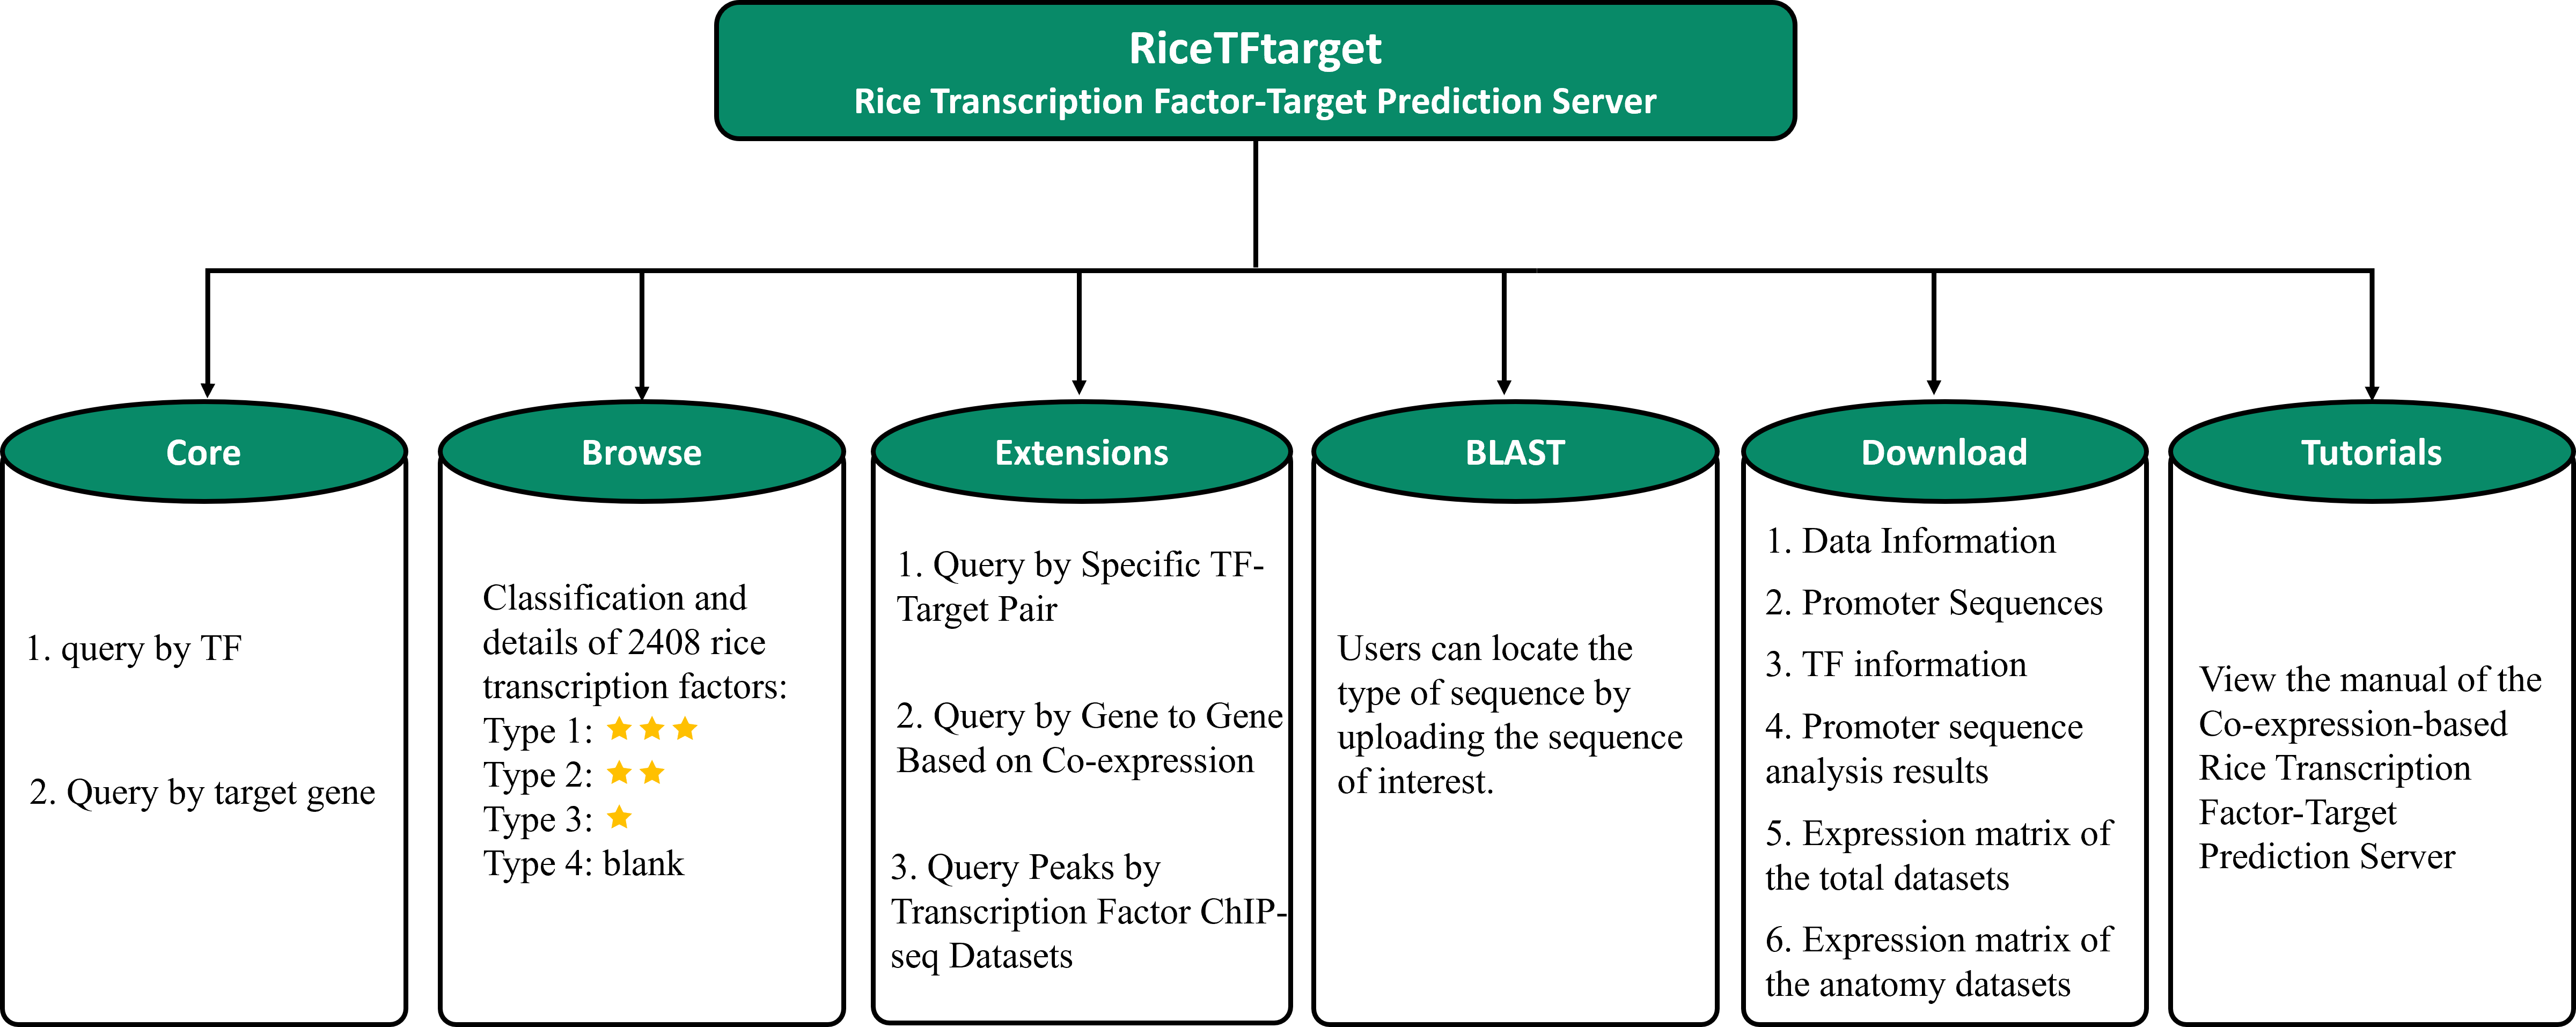
Web structure
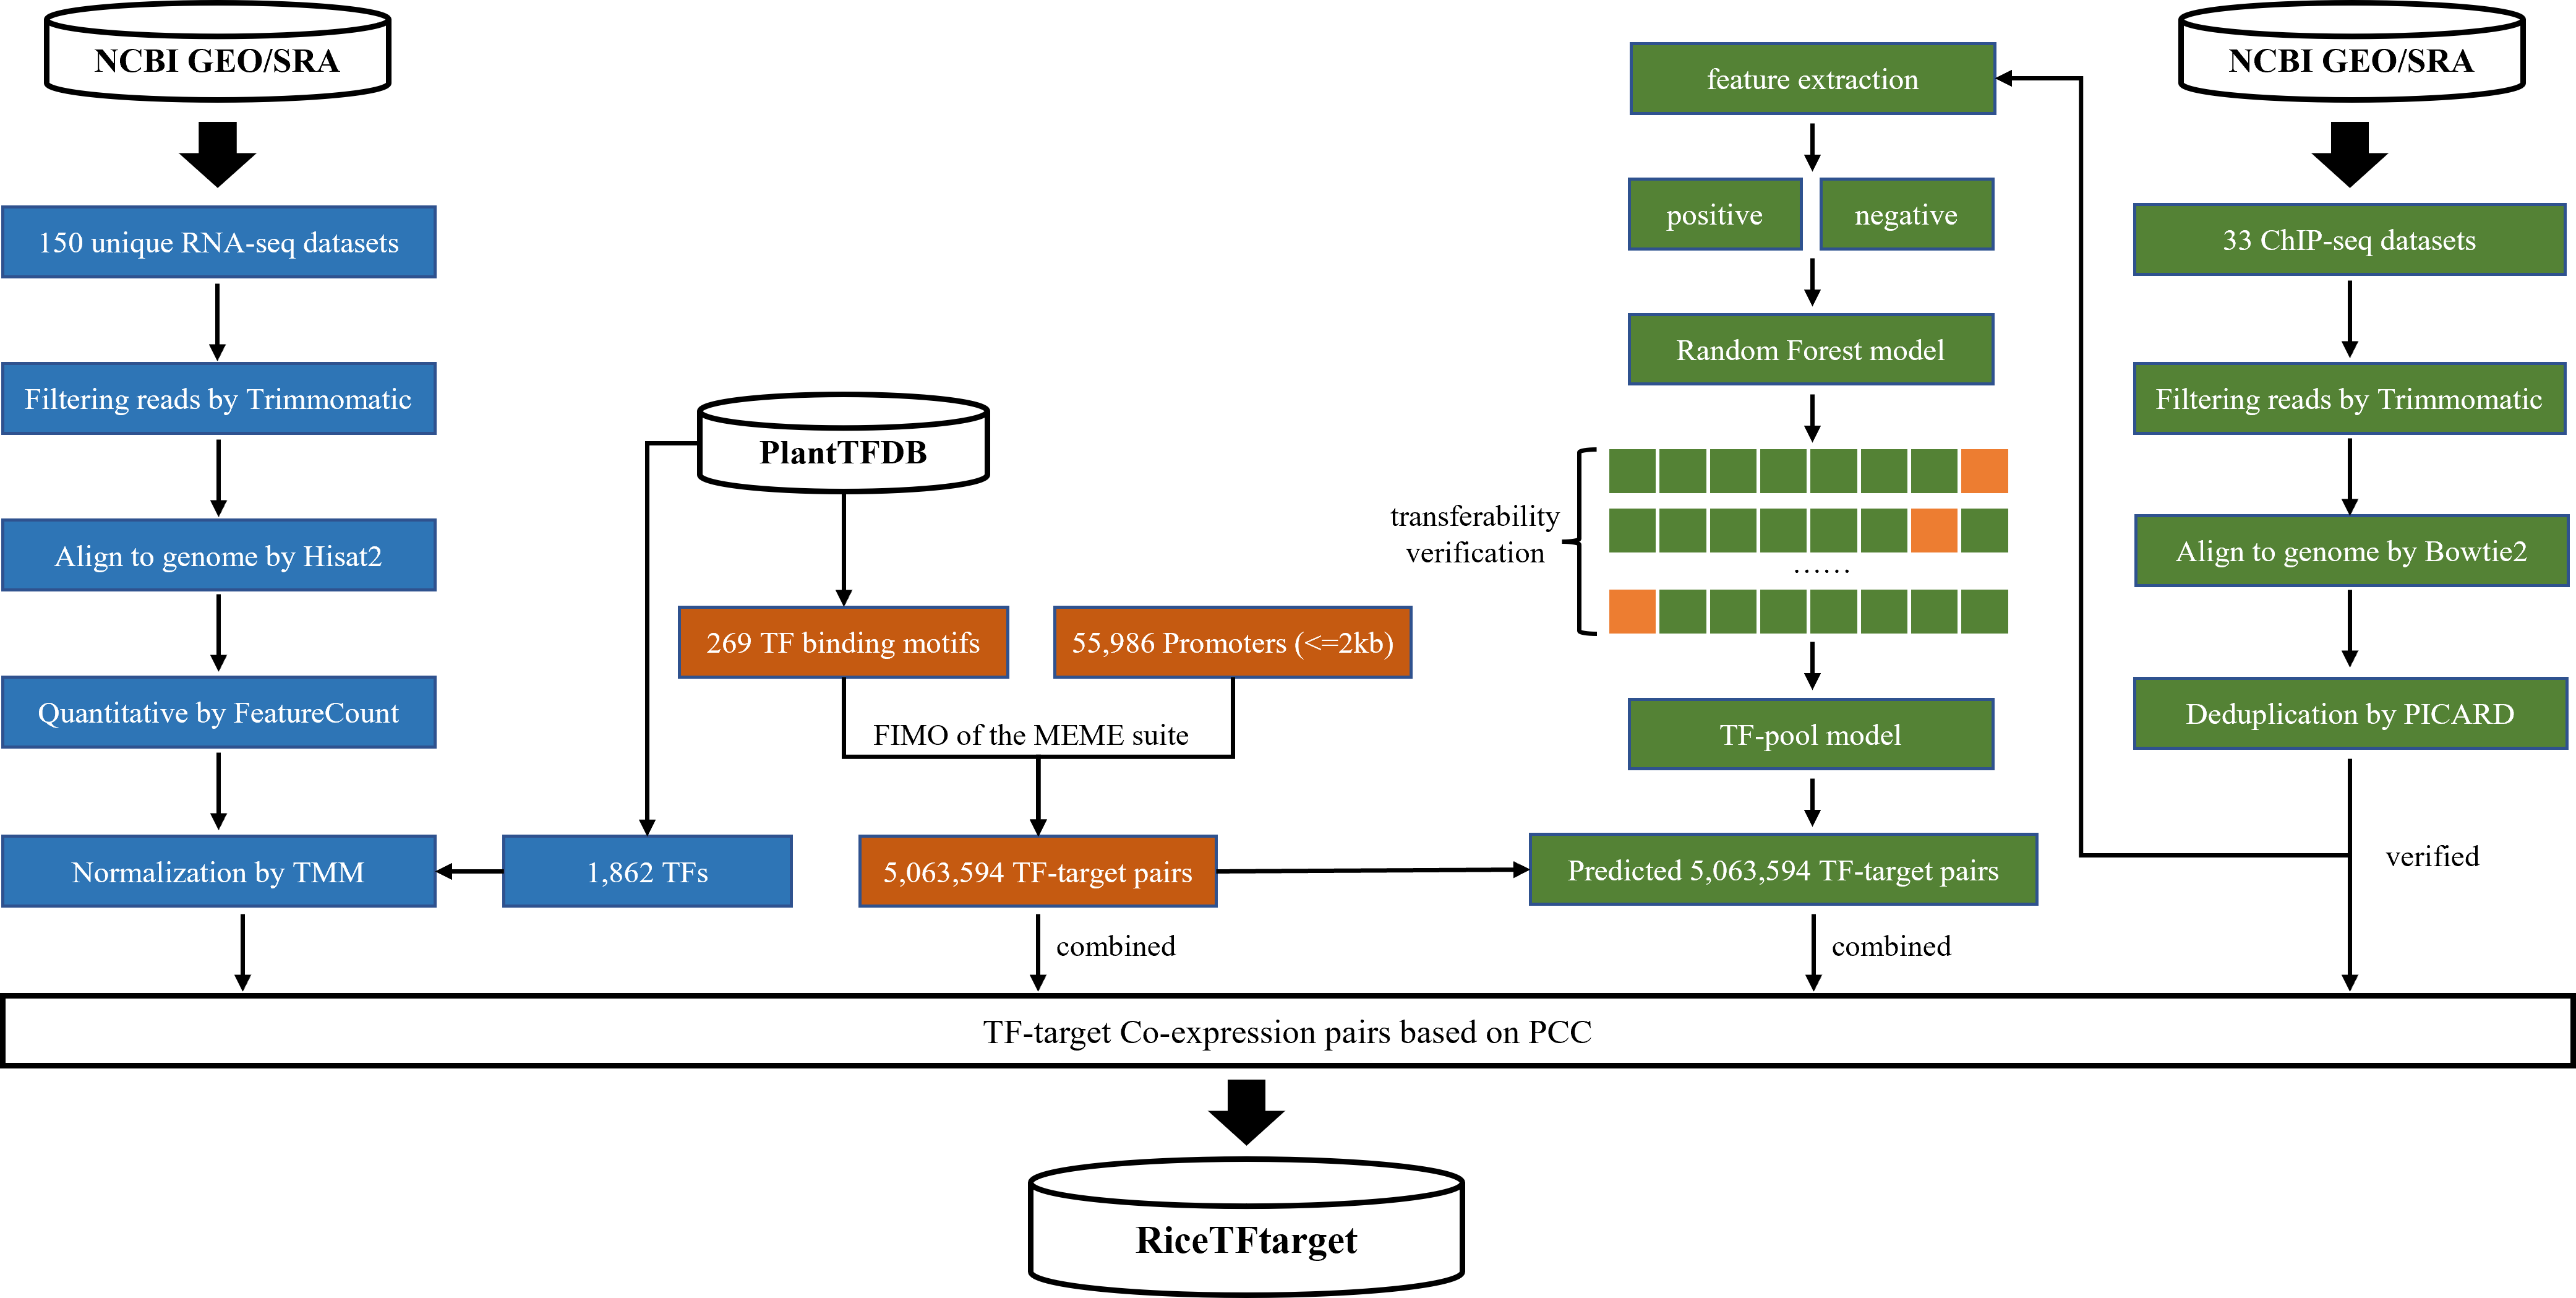
Analysis pipeline
Core function
Query by Transcription Factor / Target Gene
parameter:
TF Gene ID: RiceTFtarget provides the gene ID of the MSU7 or RAP-DB version commonly used in rice as the search name. Such as LOC_Os02g52780 or Os02g0766700. Also you can perform ID conversion in our other tool (IDCT).
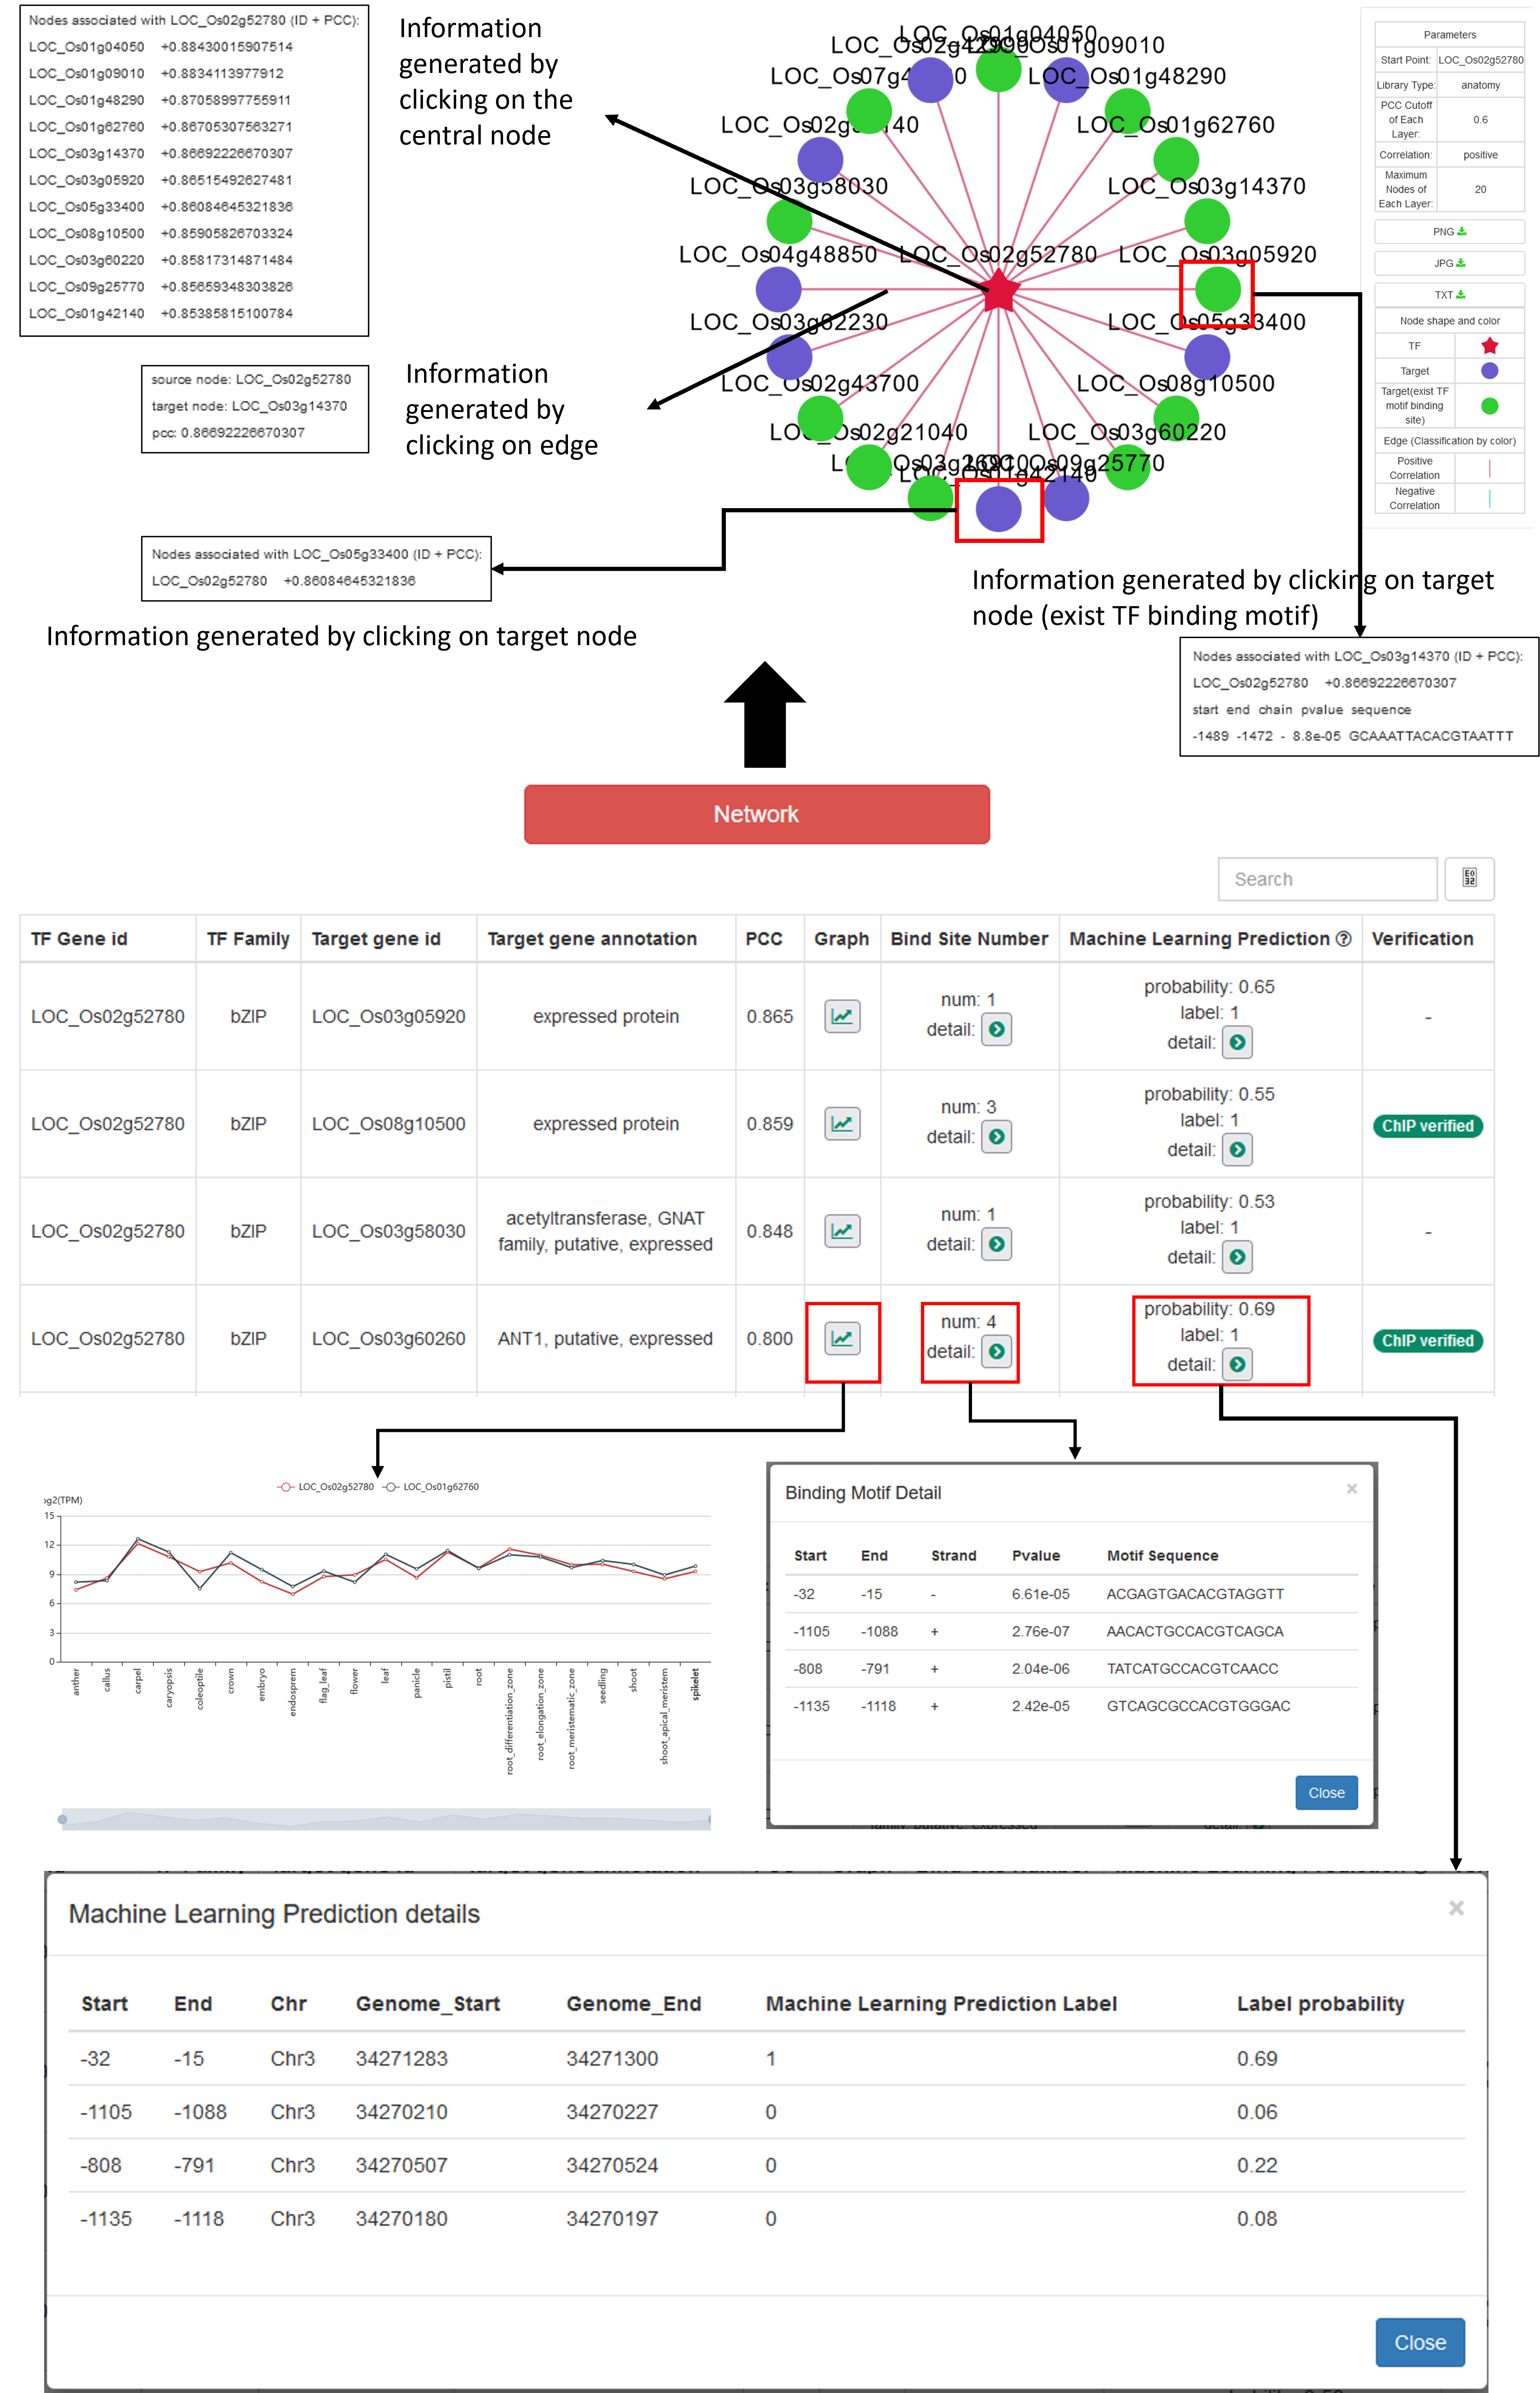
PCC cutoff: The Pearson correlation coefficient (PCC) is a value between -1 and 1, the closer to 1 the higher the correlation, and the closer to 0 the lower the correlation. Works with Correlation for user-defined PCC thresholds.

Library Type:
tissue-based: Calculate the PCC based on the expression of 21 different tissues in rice.
whole-based: Calculate the PCC based on the expression of 149 unique RNA-seq datasets in rice.
Promoter Motif Bind: Whether to combine FIMO-based promoter sequence analysis results (FIMO:default parameters)
unlimited: Based on co-expression-based TF-targets, all results are shown regardless of the presence or absence of TF binding motifs on the promoter of target gene.
Must be >= 1: Based on co-expression-based TF-targets, only the results of the presence of TF binding motif on the target promoter are shown.
Machine Learning Prediction Label: Label type predicted by machine learning model (0 or 1)
0: The predicted binding site is not TFBS.
1: The predicted binding site is TFBS.
Maximum of Nodes (result page): Sort the results according to the size of the PCC, you can take "top5", "top10", "top20" and "use all results" respectively. Since some transcription factors may have a large number of target genes under the condition of the PCC threshold input by the user, which makes the network very messy, the user can select "top n" to obtain a clean network.
Operating procedures:
Browse
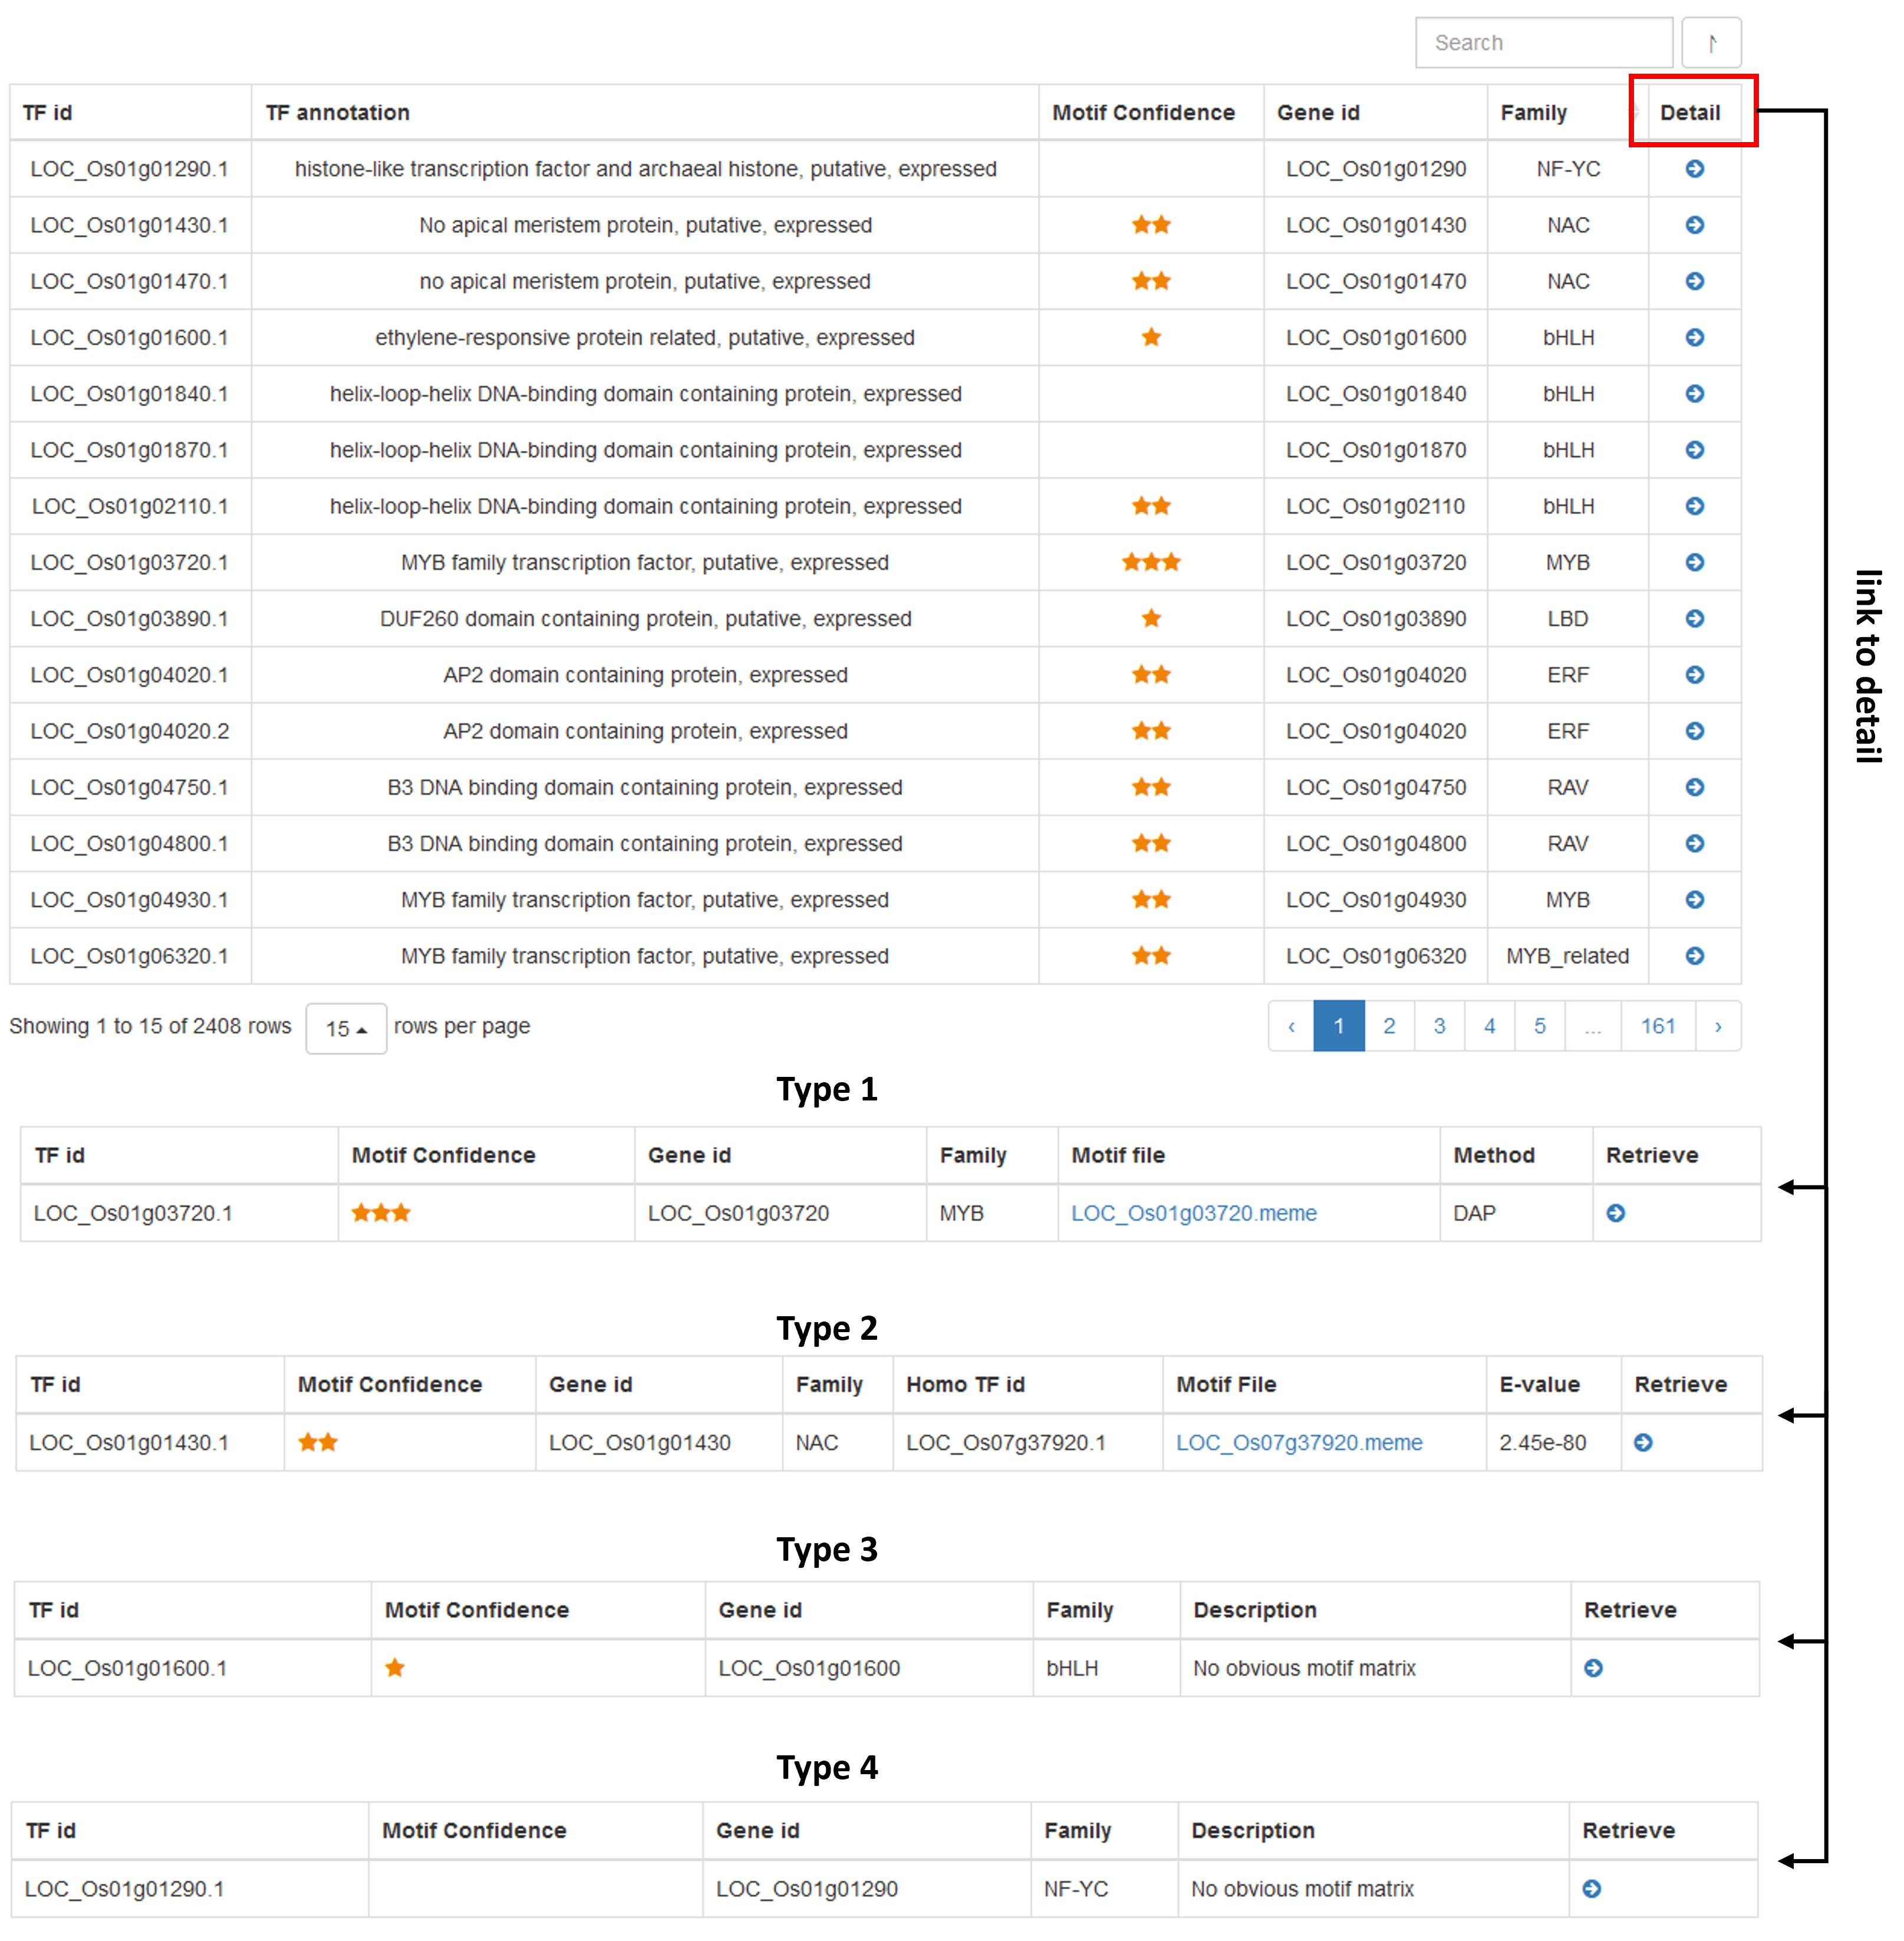
The number of stars to represent the confidence level of TF binding motif.
| type 1 () | A set of manually curated, non-redundancy and high-quality TF binding motifs downloaded from PlantTFDB |
| type 2 () | In the same family, the TFs with high sequence similarity(e-value < 1e-10) to the three stars use the same motif |
| type 3 () | In the same family, the TFs with medium sequence similarity(e-value > 1e-10 or e-value < 1e-4) to the three stars use the same motif |
| type 4 (blank) | No TF binding Motifs (e-value > 1e-4) |
col 1: The transcript ID of the transcript factor.
col 2: The annotation of the transcript factor.
col 3: Motif Confidence. Motif-based classification of transcription factors. As shown in the table above. TF binding motifs were used for promoter sequence analysis in the FIMO program. For type2 () and type3 () transcription factors, the TF binding motifs were shared with type1 () transcription factors which hold the manually curated, non-redundancy and high-quality TF binding motifs in promoter sequence analysis.
col 4: Gene ID corresponding to transcript factor ID.
col 5: Family Classification of Transcription Factors.
col 6: Detail:
type 1: Motif file download in meme format.
type 2 or type 3: E-value for homology alignments with type 1 transcription factor; Gene ID of the corresponding type 1 transcription factor.
type 4: no additional details
Operating procedures:
Extensions
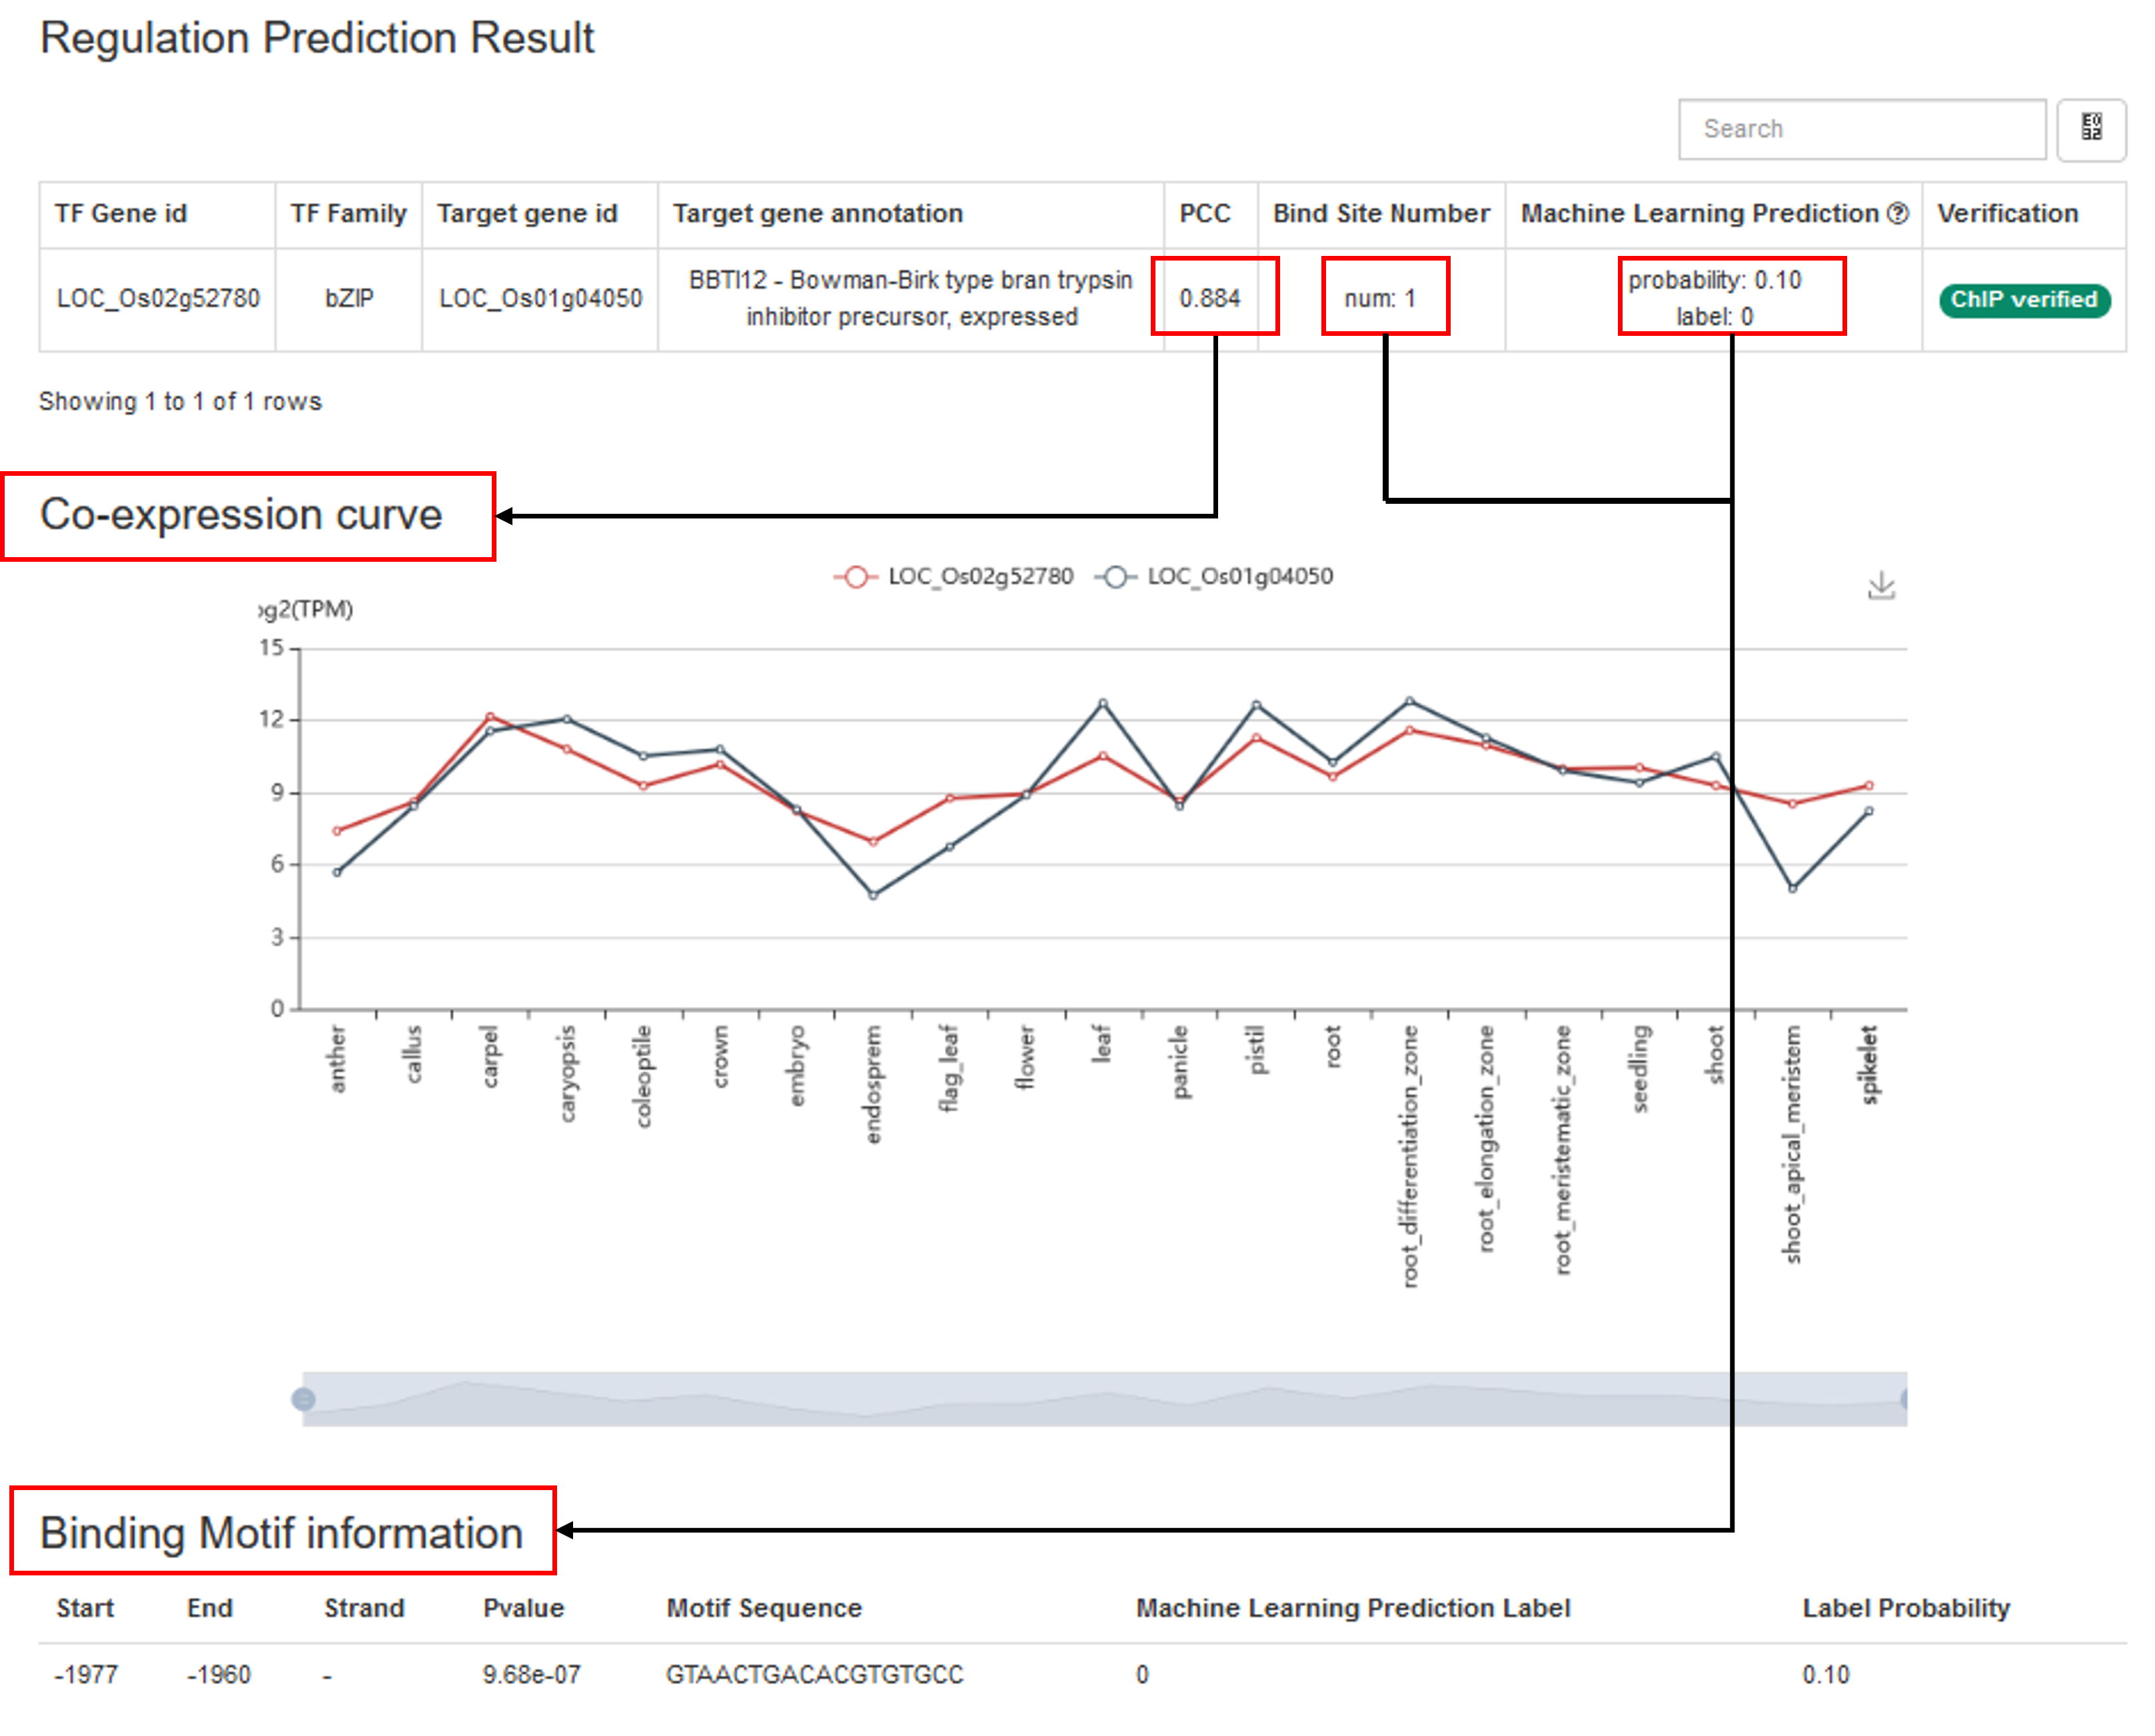
Panel I: Query by Single Transcription Factor and Target Gene Pair
Interpretation of parameters is the same as for Core function.
Operating procedures:
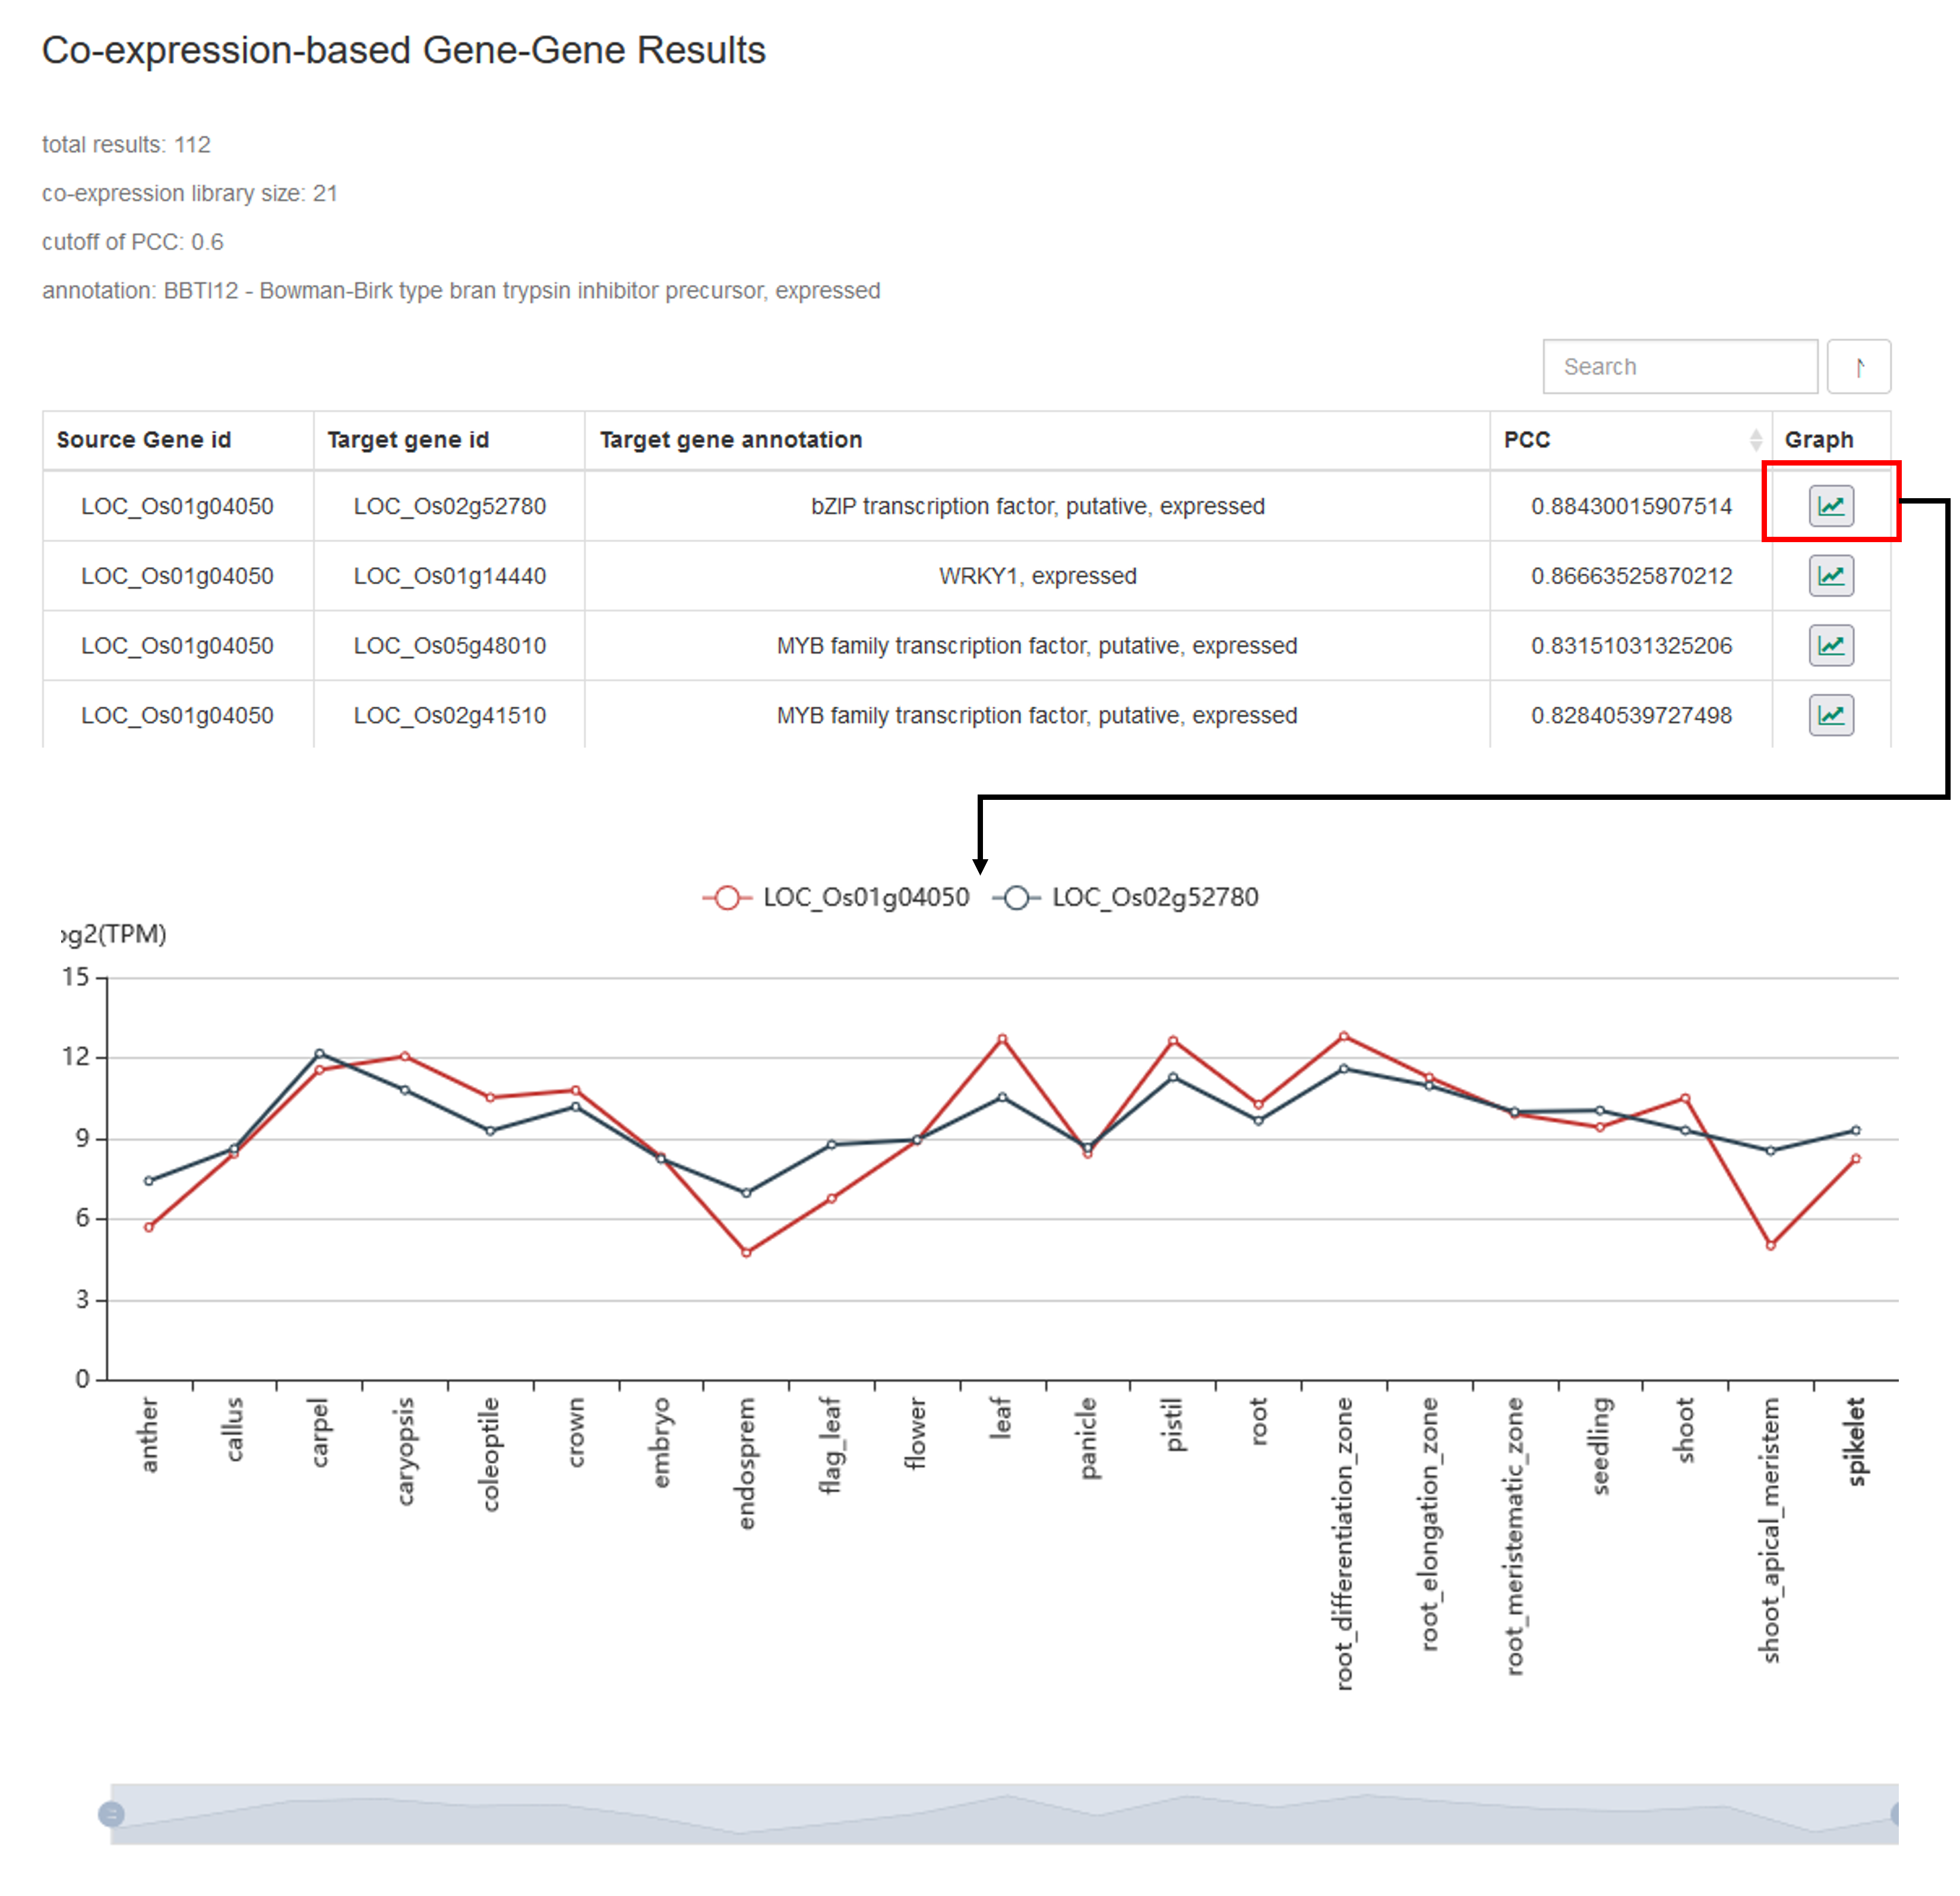
Panel II: Query by Gene to Gene Based on Co-expression
parameter:
Maximum of Nodes: Sort the results according to the size of the PCC, you can take "top5", "top10", "top20" and "use all results" respectively. Since some transcription factors may have a large number of target genes under the condition of the PCC threshold input by the user, which makes the network very messy, the user can select "top n" to obtain a clean network.
Operating procedures:
Panel III: Query Peaks by Transcription Factor ChIP-seq Datasets
parameter:
TF Query: The peaks annotation results of 33 rice transcription factor ChIP-seq datasets. Users can query by transcription factor ID, transcription factor alias, and the conditions (stress stimuli) by the ChIP-seq dataset.
col 1 (peak_chr): Chromosomes with significantly enriched peaks.
col 2 (peak_start): Chromosomal start positions where significantly enriched peak is located.
col 3 (peak_end): Chromosomal end positions where significantly enriched peak is located.
col 4 (peak_length): Length of peak.
col 5 (abs_summit): Summit position of the peak.
col 6 (pvalue): The significance p-value of the peak.
col 7 (annotation): Annotation of peak location, including 5' UTR,3' UTR, Downstream (<1kb) ,Downstream (1-2kb), Downstream (2-3kb), Exon, Intron, Promoter (<1kb), Promoter (1-2kb).
col 8 (genechr): Chromosomal location information of peak-related gene.
col 9 (genestart): Chromosomal start position of peak-related gene.
col 10 (geneend): Chromosomal end position of peak-related gene.
col 11 (genelength): Length of peak-related gene.
col 12 (genestrand): Strand of peak-related gene.
col 13 (geneid): The gene ID of peak-related gene.
col 14 (transcriptid): The trancript ID of peak-related trancript.
col 15 (distancetotss): Peak distance from peak-related gene TSS.
col 16 (geneannotation): Annotation information of peak-related genes.
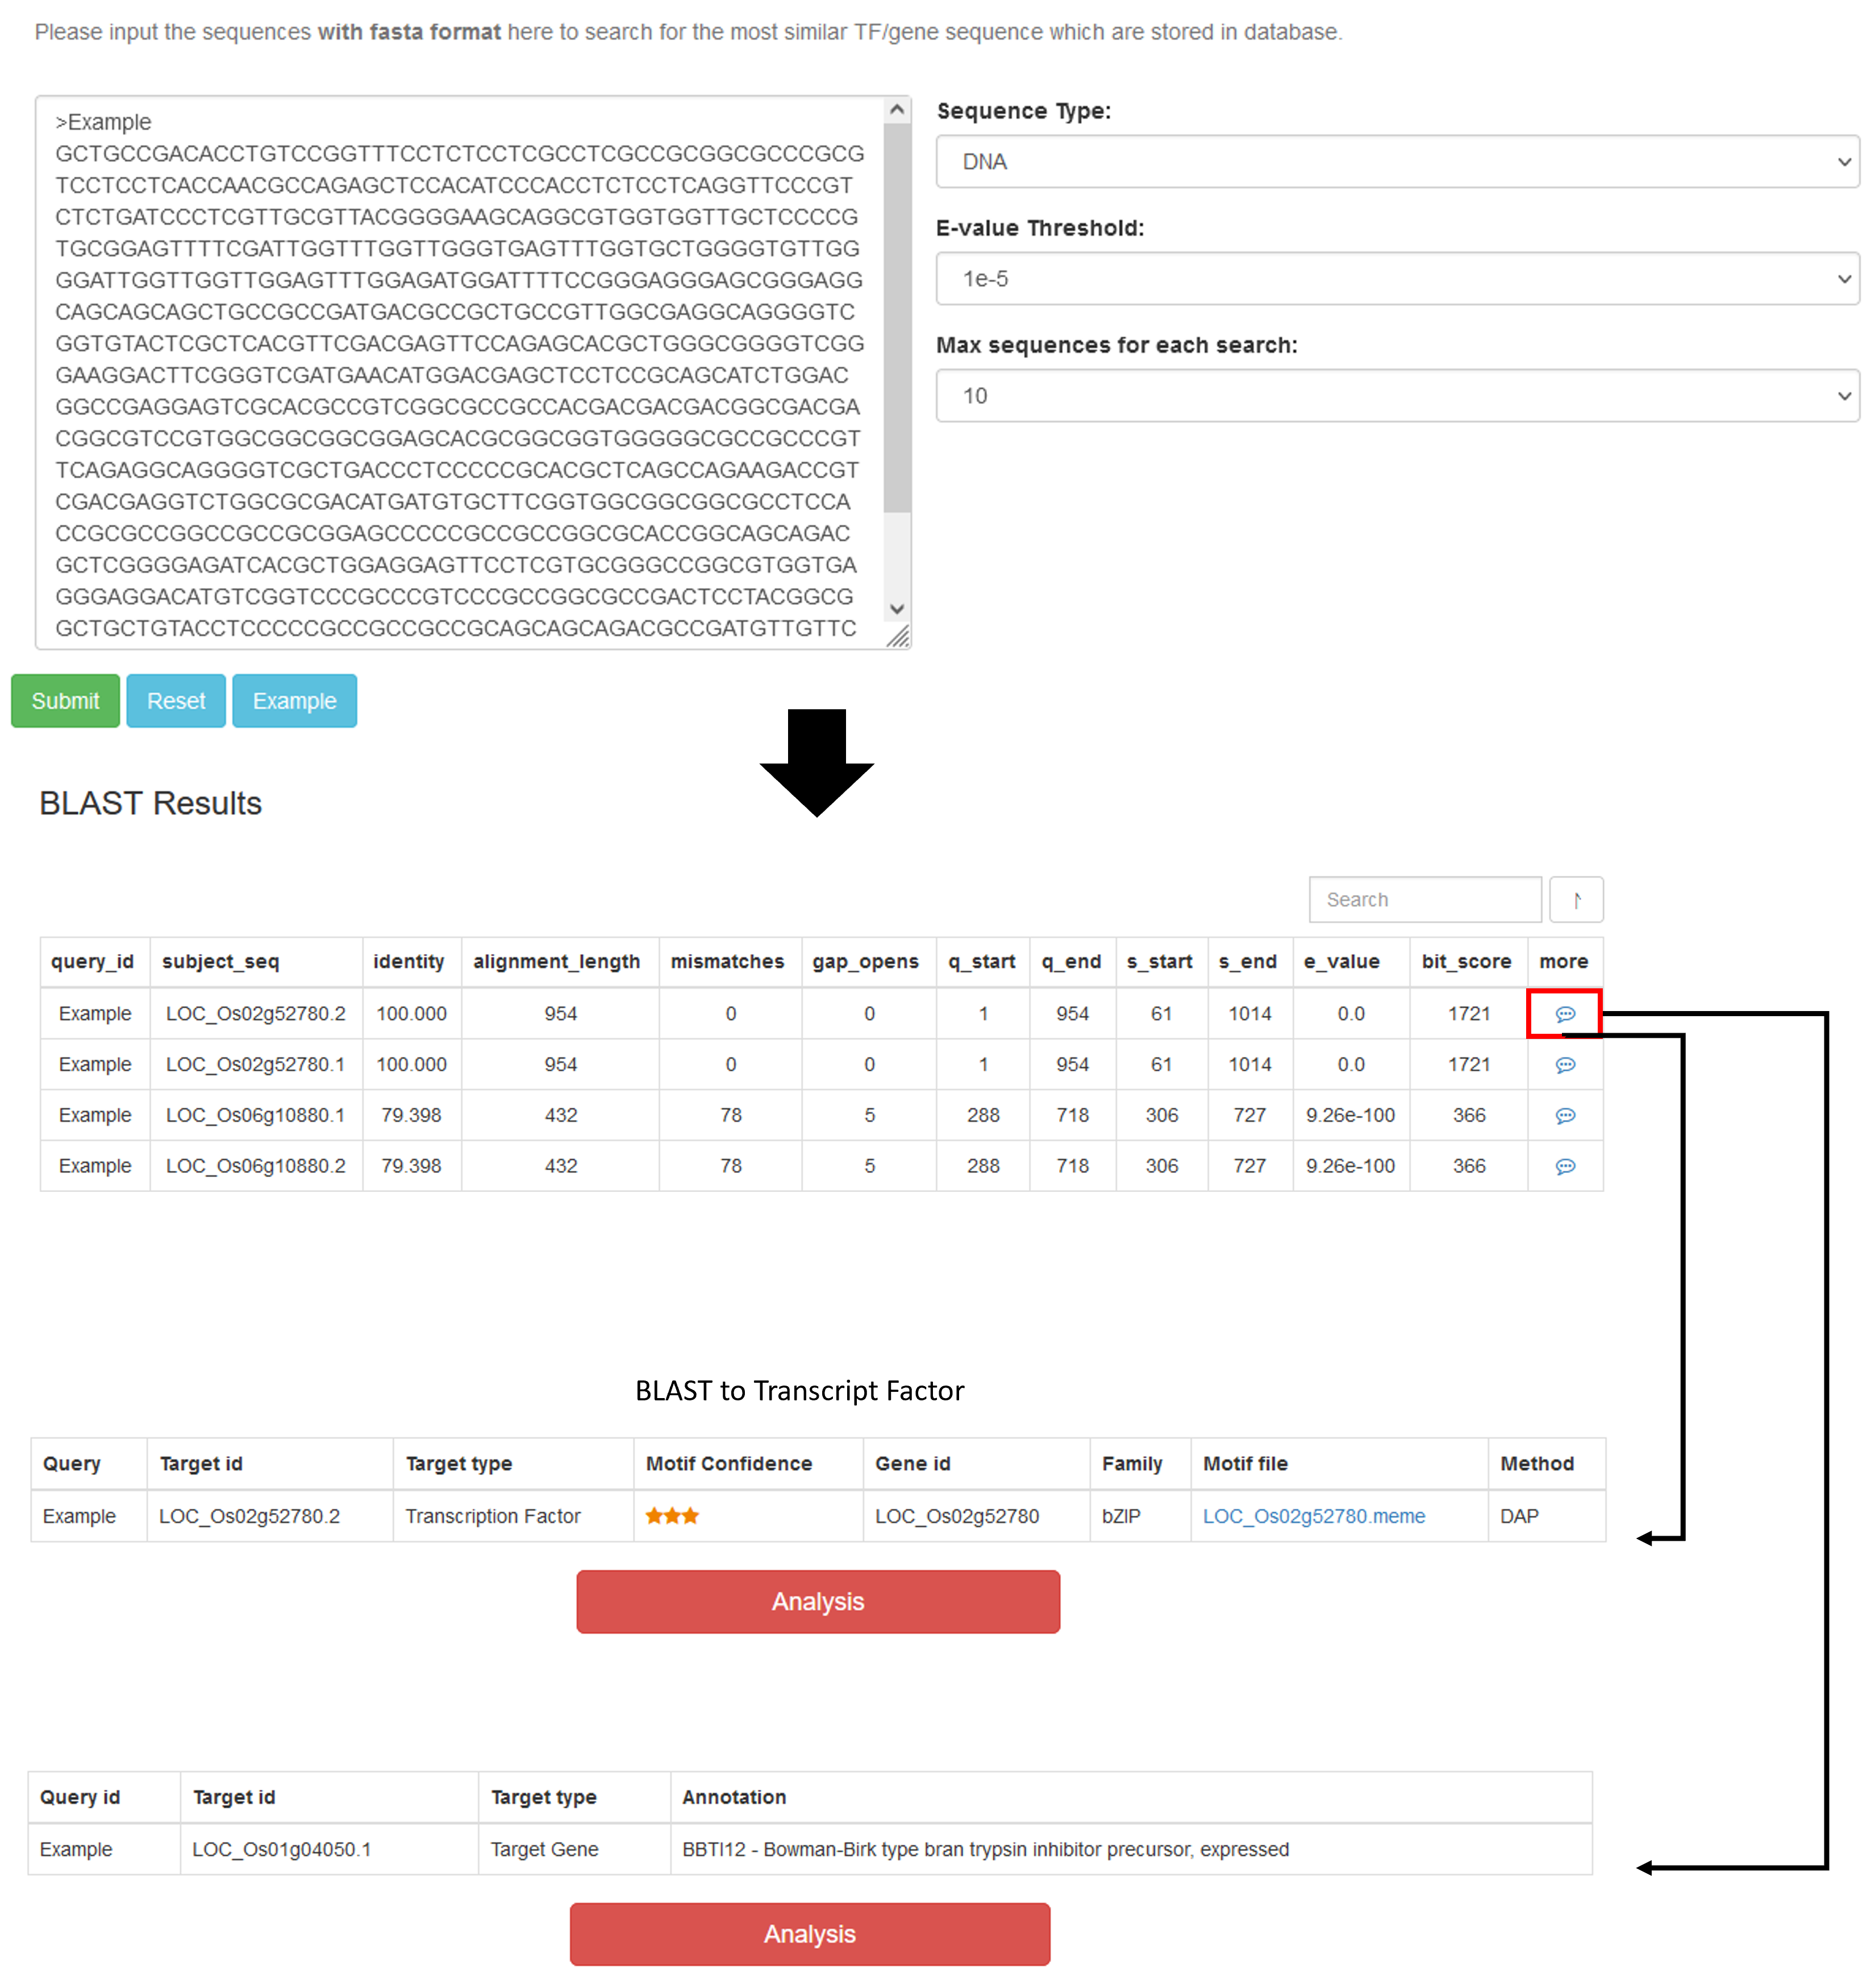
BLAST
Input the DNA or protein sequences with fasta format to search for the most similar TF/gene sequence
Operating procedures: